How do I interpret the sleep graph. I have solid green and then thin white lines.
how do I interpret the sleep graph. I have solid green and then thin white lines
Apple Watch Series 6, watchOS 7
how do I interpret the sleep graph. I have solid green and then thin white lines
Apple Watch Series 6, watchOS 7
Based on your iPhone usage at night, Sleep on iPhone tracks and charts your Time In Bed. The bar graph by default is set to W for weekly. Tap M at the top of the chart to view your sleep history for the past month. Tap Show More Sleep Data to review your Sleep Duration details such as your Average Time in Bed and Average Time Asleep. You can tap each detail to see how it charts in the graph above.
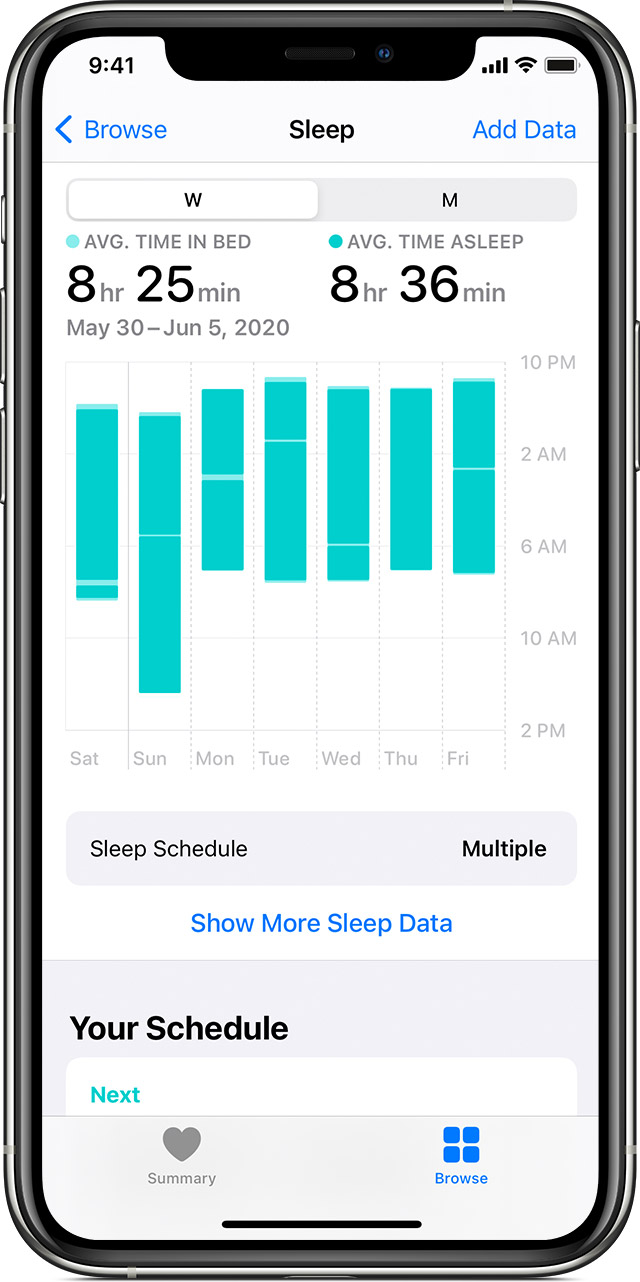
The thin less green lines are when you are in bed but not considered "asleep." This could mean you are actually awake or, more likely, restless in bed for a prolonged (trackable) amount of time.
Based on your iPhone usage at night, Sleep on iPhone tracks and charts your Time In Bed. The bar graph by default is set to W for weekly. Tap M at the top of the chart to view your sleep history for the past month. Tap Show More Sleep Data to review your Sleep Duration details such as your Average Time in Bed and Average Time Asleep. You can tap each detail to see how it charts in the graph above.
The thin less green lines are when you are in bed but not considered "asleep." This could mean you are actually awake or, more likely, restless in bed for a prolonged (trackable) amount of time.
How do I interpret the sleep graph. I have solid green and then thin white lines.