Here's an example that may give you some insights. I've set it for a single player, but adding others should require only adding a score column for each player, and copying the formulas doing the calculations into new columns to create a set for each player.
I've used three tables: one on which to record the scores, a second to extract the scores needed to calculate the handicaps, and a third to display the result(s).
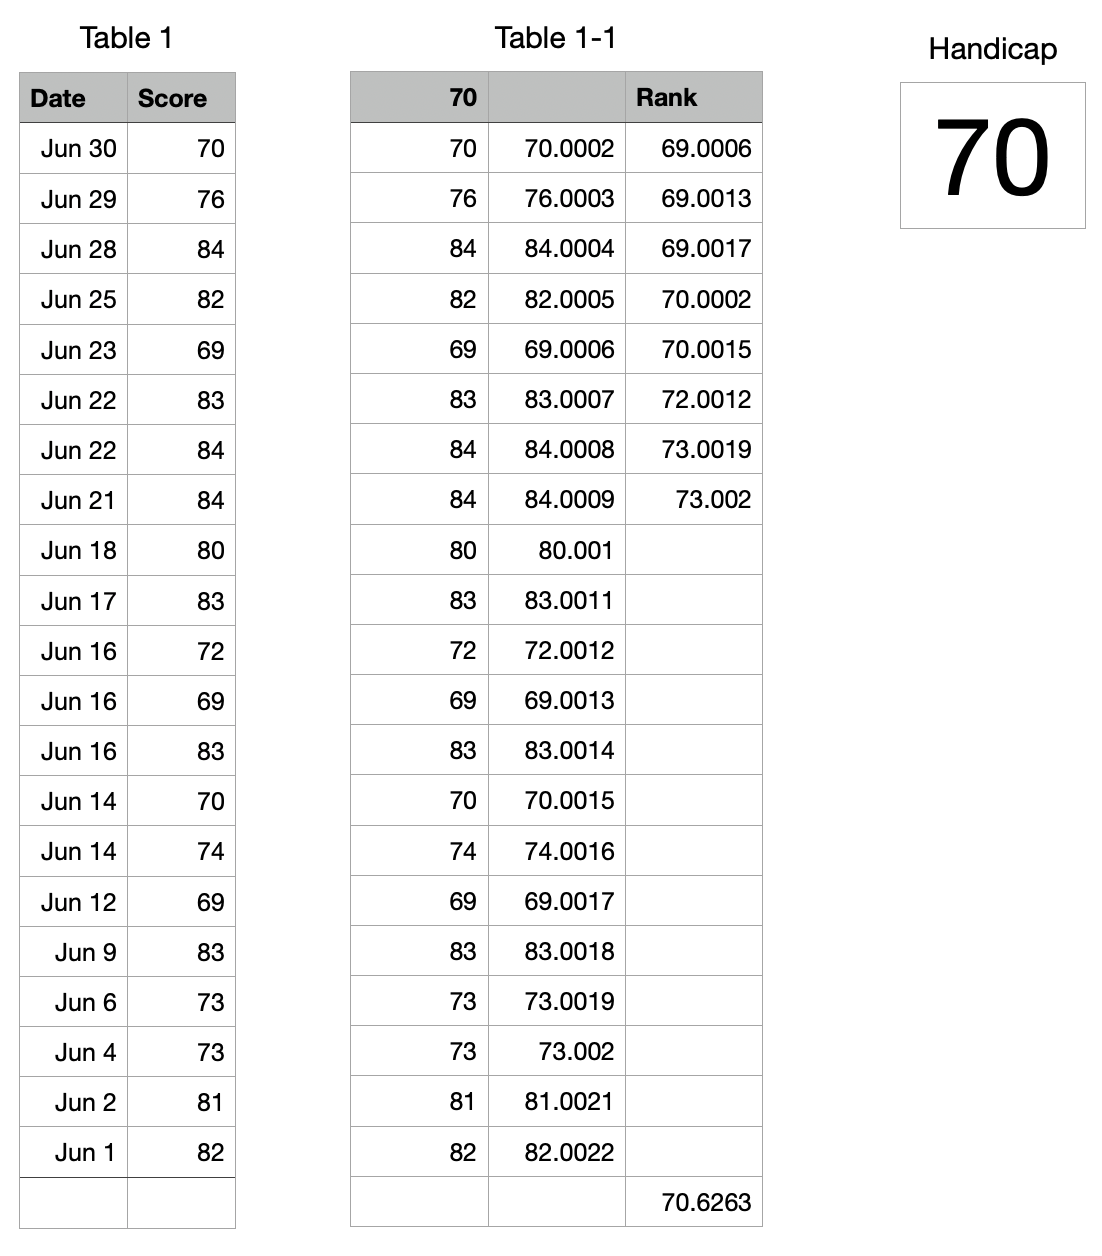
Table 1 contains no formulas, and is used only to record the dates and scores of each game.
Table 1-1 collects the scores of the most recently entered 20 games in column A, modifies them to ensure that there are no duplicate scores, extracts the eight best scores and placeTable 1-2s them in Column C.
Table 1-2 (renamed Handicap) collects the eight best (modified) scores, then calculates the average of those eight, and strips the fractional part and returns the handicap score.
Here's an example that may give you some insights. I've set it for a single player, but adding others should require only adding a score column for each player, and copying the formulas doing the calculations into new columns to create a set for each player.
I've used three tables: one on which to record the scores, a second to extract the scores needed to calculate the handicaps, and a third to display the result(s).
Table 1 contains no formulas, and is used only to record the dates and scores of each game.
Table 1-1 collects the scores of the most recently entered 20 games in column A, modifies them, adding a small fractional value to each one to ensure that there are no duplicate scores, extracts the eight best scores and places them in Column C.
Table 1-2 (renamed Handicap) collects the eight best (modified) scores, then calculates the average of those eight, and strips the fractional amount and returns the integer average score for the most recent 20 games
Table 2 formula, entered in cell A2, and filled down to A21:
Setting the offset starting point to B1, and locking the row reference to that row, then setting the RowOffset to one less than the row in which this copy of the formula is placed ensures that the first score transferred to A2 of Table 1-1 will always come from (the current) row 2 of Table 1, and the last value in the list will come from (the current) row 21.
Table 1-3 ("Handicap") uses this formula to calculate the Integer Average of the 8 best scores (listed in rows 2 to 9 of Table 1-1, and presents that as the Handicap score level.
Formula in Handicap:A1:
(Note that the player has inserted a new 'Row 2, and entered a new round's score (better than any of the others)
You mentioned that the handicap 'is determined by best 8 scores of last 20 (rounds)', but gave no details regarding how it was clculated from those values. For the 'integer Average' vlue calculated above, my formula was the one shown above, entered in cell A1 of Handicap. The actual calculation may require a different formula. If so, please provide a description of the calculation to be performed on these eight scores.
Regards,
Barry
PS: To insert a new 'Row 2' on Table 1:
Single click on the Date cell in the current Row 2.
Press option-up arrow to insert a new row above Row2.
The new row will be the same type ('standard') as the selected one.
Had you clicked on cell A1, then pressed option-down arrow, a new row 2 would be inserted below row 1, but it would be a Header row — not the type you want here.
B.