I had been searching for the same and write an Applescript script that do it. I will appreciate if somebody can help improving the user interaction, the error handling and the speed (it's not a problem if the tables are not big, and you don't need to run it many times).
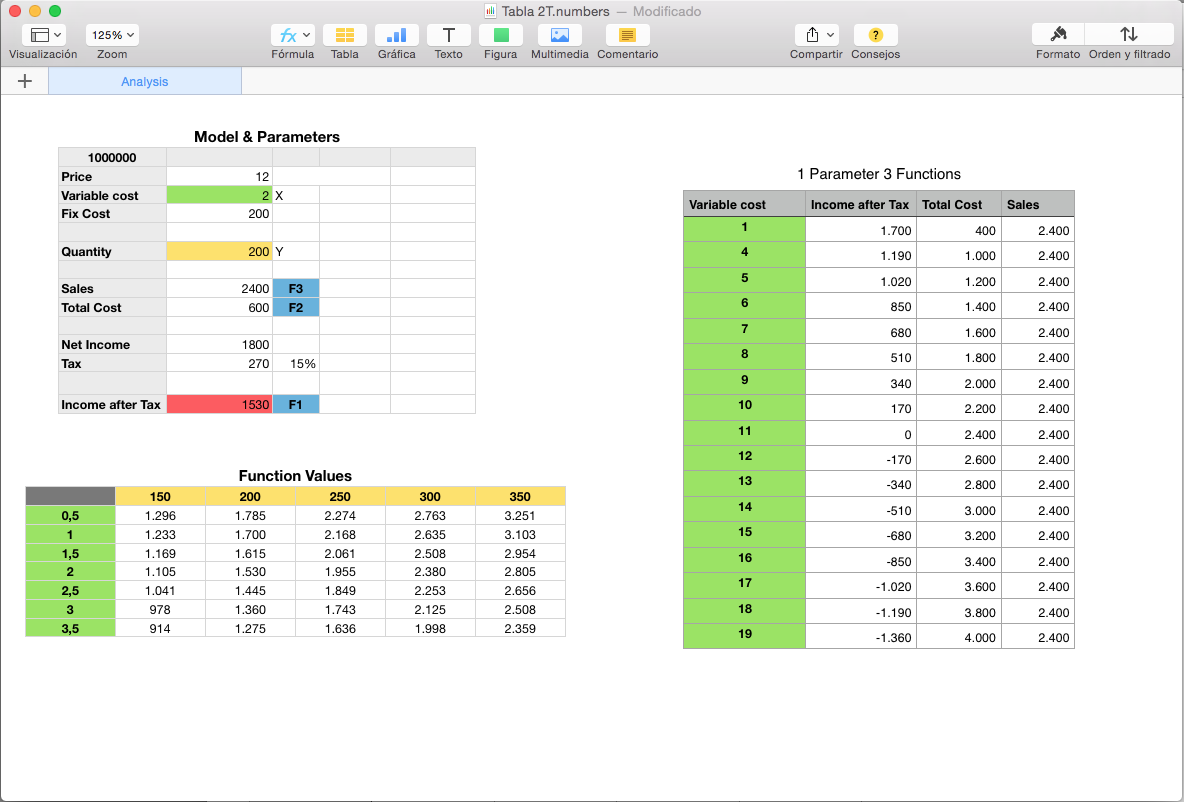
The script need the document to be open on the sheet that contains the tables you are working with. One table must contain the "model" with the parameters or variables and the formulas. The other must be prepared to receive the results with the values of the parameters on the first column and the first row for the two parameters option. For one parameters and multiple results, the table needs to have the values of the parameter in the first column and the first row may be empty or with the name of the parameter and results.
Below is the script. I test it with a simple model. Here is a screen shot of it:
on rangeSelection(documentPar, sheetPar, tablePar, messagePar)
tell application "Numbers" to tell documentPar to tell sheetPar
tell tablePar
set selection range to range "A1"
display dialogmessageParwith title "OK & Select"
set waiting to true
repeat while waiting
if selection range is not equal to range "A1" then
if selection range is not missing value then
set waiting to false
set cellName to name of selection range
end if
end if
end repeat
end tell
end tell
return cellName
end rangeSelection
-----Main Script
tell application "Numbers"
set numberOfParam to button returned of (display dialog "Select 1 or 2 parameters for the analisys" buttons {1, 2} default button 1) as number
set ActiveDocum to document 1
tell ActiveDocum
set workingSheet to active sheet
tell workingSheet
-- create a list with the names of all the available tables on the active sheet
set allTables to {}
repeat with tableX in every table
copy name of tableX to end of allTables
end repeat
set DefaultTable to item 1 of allTables
--select the table for the model
set modelTableName to (choose from listallTableswith title "Select & OK" with prompt "Select Model Table" default itemsDefaultTable without multiple selections allowed) as text
set modelTable to tablemodelTableName
--select the table for the results, the sensitivity analysis
set availableTables to {}
repeat with tableX in allTables
if tableX as text is not equal to modelTableName then
copy tableX to end of availableTables
end if
end repeat
set DefaultTable to first item of availableTables
set sensitivityTableName to (choose from listavailableTableswith title "Select & OK" with prompt "Select Results Table" default itemsDefaultTable without multiple selections allowed) as text
set sensitivityTable to tablesensitivityTableName
if sensitivityTable is equal to modelTable then
set alertResult to display alert "Error. Can't select the same table for Model and Results" buttons {"Cancel"} as warning default button "Cancel" cancel button "Cancel"
end if
end tell
end tell
end tell
set oTID to text item delimiters
set text item delimiters to ":"
-- get cell with the parameter X
set explText to "Select Vertical Variable Parameter (X) in table: \"" & modelTableName & "\", after closing this window"
set cellNameX to first text item of rangeSelection(ActiveDocum, workingSheet, modelTable, explText)
if numberOfParam is 2 then
-- get cell with the parameter Y
set explText to "Select Horizontal Variable Parameter (Y) in table: \"" & modelTableName & "\", after closing this window"
set cellNameY to first text item of rangeSelection(ActiveDocum, workingSheet, modelTable, explText)
-- get cell with the result of the function object of the analysis
set explText to "Select the cell with the result in table: \"" & modelTableName & "\", after closing this window"
set cellNameF to first text item of rangeSelection(ActiveDocum, workingSheet, modelTable, explText)
else
--tell application "Numbers"
set numberOfResults to text returned of (display dialog "How many results in the analisys?" default answer 2) as number
--end tell
-- get cells with the results object of the analysis
set cellNamesFn to {}
repeat with n from 1 to numberOfResults
set explText to "Select the cell with result Nº " & n & " in table: \"" & modelTableName & "\", after closing this window"
copy first text item of rangeSelection(ActiveDocum, workingSheet, modelTable, explText) to end of cellNamesFn
end repeat
end if
set text item delimiters to oTID
tell application "Numbers"
tell ActiveDocum
tell workingSheet
tell modelTable
-- create references to cells; this way can set the values of those cells within a tell to other table
set cellXref to a reference to cell cellNameX
if numberOfParam is 2 then
set cellYref to a reference to cell cellNameY
set functResultRef to a reference to cell cellNameF
else
set functNaRef to {}
repeat with n from 1 to numberOfResults
set functRef to (a reference to cell (item n of cellNamesFn))
copy functRef to end of functNaRef
end repeat
end if
end tell
-- backup original cell contents to restore them at the end
if formula of cellXref is missing value then
set buX to value of cellXref
else
set buX to formula of cellXref
end if
if numberOfParam is 2 then
if formula of cellYref is missing value then
set buY to value of cellYref
else
set buY to formula of cellYref
end if
tell sensitivityTable
set numberOfRows to row count
set numberOfCols to column count
-- calculate and fill the results in the analisys table
repeat with rowCount from 2 to numberOfRows
tell column "A"
set value of cellXref to value of cell rowCount
repeat with colCount from 2 to numberOfCols
tell row 1 to set value of cellYref to value of cell colCount
tell row rowCount to set value of cell colCount to value of functResultRef
end repeat
end tell
end repeat
-- restore original contents of parameters X and Y
set value of cellXref to buX-- works the same if buX is a number or a formula
set value of cellYref to buY
end tell
else -- numberOfParam is 1
tell sensitivityTable
set numberOfRows to row count
set numberOfCols to numberOfResults
-- add the necessary columns to the table
if column count is less than (numberOfResults + 1) then set column count to (numberOfResults + 1)
-- calculate and fill the results in the analisys table
repeat with rowCount from 2 to numberOfRows
tell column "A"
set value of cellXref to value of cell rowCount
repeat with colCount from 2 to (numberOfResults + 1)
--tell row 1 to set value of cellYref to value of cell colCount
tell row rowCount to set (value of (cell colCount)) to (value of (item (colCount - 1) of functNaRef))
end repeat
end tell
end repeat
-- restore original contents of parameters X
set value of cellXref to buX-- works the same if buX is a number or a formula
end tell
end if
end tell
end tell
end tell