As I wrote in my late post, a trendline is an approximative representation of a function.
The one calculated by Numbers is perfectly calculated as it assumed that the x values associated to the given ones are 1, 2, 3
Alas for you, a logarithmic trendline can't exactly join your three points.
This is why I decided to build a trendline using only the first and the last values.
In my late post I did that with values calculated from your equation.
I repeat the game with the x values 1, 2 and 3
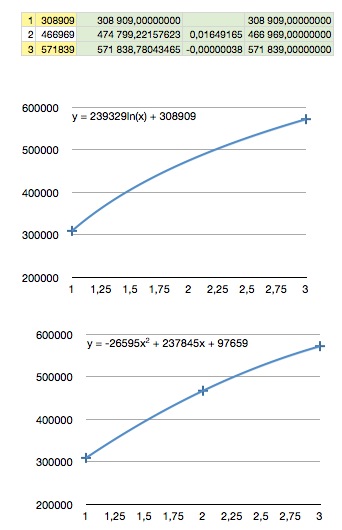
Using only these two points (cells with yellow background), Numbers built the best logarithmic trendline which may be offered.
In the column C (green background) I used these trendline equation to calculate y values.
As you may see, the first value matches perfectly the original one, the value for x =2 is exact with a tolerance of 16/1000
the third point is exact with a tolerance of -38/100 000 000
For physical measures it would be considered as a correct result.
As you see, the values aren't matching exactly your initial ones.
The chart at the bottom was built with the range A1…B3
I didn't asked for a logarithmic trendline but for a polynomial one .
Calculating the y value with this equation match perfectly the original values.
This doesn't prove that the second scheme is better than the first one.
I don't know what you want to achieve starting from these datas.
If you want to make previsions for years 2011 and 2012 for instance,
the logarithmic curve will return 640689 for 2011 and 694094 for 2012
the polynomial one will return 623519 for 2011 and 622009 for 2012
It's not surprising because the polynomial curve has a local maximum value and a local minimum one.
Clearly, the local maximum one is reached during year 2012.
But nothing allow us to say that one is better than the other one because nobody knows the true statistical behaving of customers.
I have a little preference for the logarithmic trendline but can't be more precise.
Honestly, at a two years horizon, we may say that they give the same results (the difference is inferior to 12% for year 2012)
If the goal is to have an idea of the hardware expansion to program, I would make my choices according to logarithmic
If the goal is to have an idea of the received cash in 2012, I would work upon the polynomial basis.
No, I'm not issued from Normandy 😉
PS, if you don't understand everything at first reading, take a breath and read a second time.
I will switch off in a few minutes so I will not be back until tomorrow.
Yvan KOENIG (VALLAURIS, France) mardi 28 juin 2011 23:15:32
iMac 21”5, i7, 2.8 GHz, 4 Gbytes, 1 Tbytes, mac OS X 10.6.8
Please : Search for questions similar to your own before submitting them to the community
To be the AW6 successor, iWork MUST integrate a TRUE DB, not a list organizer !
<Edited by Host>
