If I remember well this problem was already treated.
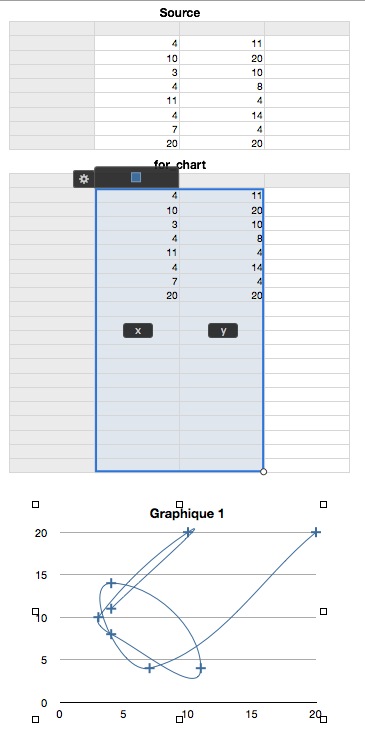
Build the table to chart with more rows than the ones extracting values from already filled cells.
Insert the formula extracting values in every cells of the table using the function ISERROR.
This way, the cells pointing to inexistent cells will contain the nil string and the chart will be correctly built.
When you will insert new values, they will appear in the charted range so they will be charted.
In cell B2, the formula is :
=IFERROR(Source :: B2,"")
In cell C2 the formula is :
=IFERROR(Source :: C2,"")
Apply Fill Down to fill the two columns.
Yvan KOENIG (VALLAURIS, France) vendredi 1 juillet 2011 12:10:46
iMac 21”5, i7, 2.8 GHz, 4 Gbytes, 1 Tbytes, mac OS X 10.6.8
Please : Search for questions similar to your own before submitting them to the community
To be the AW6 successor, iWork MUST integrate a TRUE DB, not a list organizer !