Hi m,
Are you thinking of a 'thermometer' graph, perhaps?
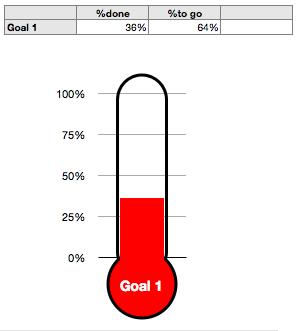
The chart itself is a stacked bar chart, showing two values: %done, and %to go.
The first is entered directly (or could come from calculations in another table).
The second is calculated using the formula =1-B (or =100%-B)
Fill colour for the first value is set to the red shown; Fill colour for the second is set to 'none'.
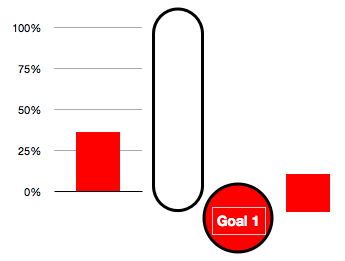
The 'thermometer' is constructed from three shapes, stacked in front of the chart in this order:
- A tall rounded rectangle. Stroke: 3mm, Fill: 'none', corner radius: large enough to provide a Rounded end, Height: To suit the chart: The straight sides should reach from the 0% line to the 100% line. Width: to fit the bar: Looking at my result, I would make the shape a bit narrower, to cover the edges of the bar.
- A circle. Stroke 3mm, Fill: same red shade as set for the Fill colour of the first value bar. Size: to fit. You want a smooth join just at the point where the rounded end of the rectangle shape finishes.
- A rectangle. Stroke: 'none', Fill: same shade of red. The rectangle is used to cover the circle where it crosses the 'thermometer' bar. Its width should be the same as the space between the vertical strokes of the rounded rectangle. Its height, and vertical position should place it where it will just cover the outline of the circle.
- A text box to contain the Goal Name. Place this on the circle, as shown. The example is 14 pt Helvetica Bold, wiht colour set to white.
Here's a view with the three shapes moved to the side to make them more visible.
Regards,
Barry