Looks like no one’s replied in a while. To start the conversation again, simply ask a new question.

Is there any way of extending a polynomial trendline in Numbers '09?

Hi,


The question title says it all really. Is there any way of extending a polynomial trendline in Numbers '09, beyond the data that I currently have? I can do this in Excel, but would like to be able to do this in Numbers too.


Thanks,


Nick

Macbook Pro, Mac OS X (10.7), 2.66 GHz Intel Core i7 8GB RAM

Posted on Nov 15, 2012 1:23 AM

Reply
Question marked as Best reply

Posted on Nov 15, 2012 4:54 AM

yes. You can by adding an adiditonal column that contains the polynomial (from the trnedline) that operates on the same x values:


User uploaded file


As you can see the predicted column extends beyond the original data. Extrapolating data should be done very carefully as it is "precidting"


In the table I added the column (C) with the title "Predicted" and added a formula that is the same as the reported trendline:


C2=1.1309*A2^2-1.2677*A2+2.039


Then I filled down

8 replies
Question marked as Best reply

Nov 15, 2012 4:54 AM in response to nick_harambee

yes. You can by adding an adiditonal column that contains the polynomial (from the trnedline) that operates on the same x values:


User uploaded file


As you can see the predicted column extends beyond the original data. Extrapolating data should be done very carefully as it is "precidting"


In the table I added the column (C) with the title "Predicted" and added a formula that is the same as the reported trendline:


C2=1.1309*A2^2-1.2677*A2+2.039


Then I filled down

Nov 15, 2012 6:09 AM in response to nick_harambee

Unfortunately there is no "forecast" feature for trendlines in Numbers. Wayne showed how to use the trendline equation from the chart to create additional data points for the chart. This is by far the simplest way to do it in Numbers but it has two drawbacks:

  1. If your data changes, you'll need to manually readjust the coefficients for your forecasted point(s).
  2. The precision of the coefficients is only three decimal places. The forecasted Y values using these coefficients might not be as accurate as you would like. For example, compare the forecasted Y value in Wayne's table at X=20 to the one in the table below.


You can avoid both problems by calculating the trendline coefficients in your table using the LINEST function. it is a little more work in the setup but it might save you time in the long run if your data changes a lot. Here is an example of for 2nd order polynomial:


User uploaded file


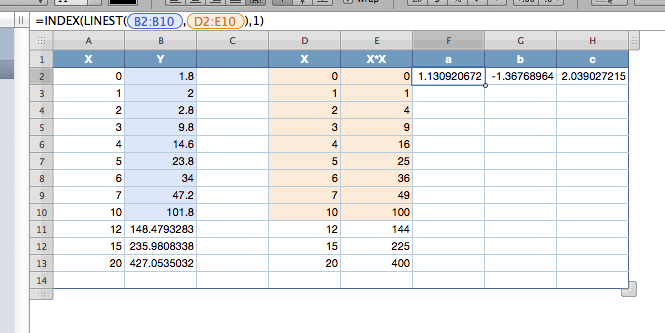
The last "real" data point is in row 10.

Formula for column D =A

Formula for column E =A*A

F2 = the coefficient for X^2 =INDEX(LINEST(B2:B10,D2:E10),1)

G2 = the coefficient for X =INDEX(LINEST(B2:B10,D2:E10),2)

H2 = the constant =INDEX(LINEST(B2:B10,D2:E10),3)


Note: If you later need to add an additional data point at the end of your data, go to the last row of your data (in this example it is row 10) and "add row below". This way the formulas for the coefficients will adjust automatically to include the new row.

Nov 15, 2012 12:40 PM in response to Wayne Contello

Thanks for these answers. I have got Wayne's method working, which I can see involves updating the formula from the trendline that is generated by Numbers each time I add new data, which is a bit of work I'd rather avoid if possible. I don't need the Y Forecast to be very precise, so this isn't an issue.


I can't quite grasp your methods Badunit. In your first example, what formula goes in B11-13?


I only need an end point, i.e. other data points are not necessary, so I like the simplicity of your second example, but I am not sure what formulas go in the Y forecast column.

Is there any way of extending a polynomial trendline in Numbers '09?

Welcome to Apple Support Community
A forum where Apple customers help each other with their products. Get started with your Apple ID.