Looks like no one’s replied in a while. To start the conversation again, simply ask a new question.

Standard error of mean for column/bar graphs

Hi,


Is it possible for me to have different standard errors in a column graph? (i.e. in a graph with 2 or more columns/bar to have their individual error bars drawn out?) So far I have only been able to have a single number for both columns in the graph.


V

Posted on Mar 21, 2013 6:20 AM

Reply
2 replies

Mar 21, 2013 10:20 AM in response to Valliance

V,


Numbers does the best it can with the information you give it. If you ask for Error Bars, Numbers will calculate the standard deviation for the series and assign that calculation result to each of the bars in the series.


If each of your values represents some statistic that in itself is accompanied by a standard error, that's another thing, but Numbers doesn't know what the error values are unless you tell it. The way to tell Numbers what the error bar values should be in these special cases is to use Custom values.


Here's an example:

User uploaded file

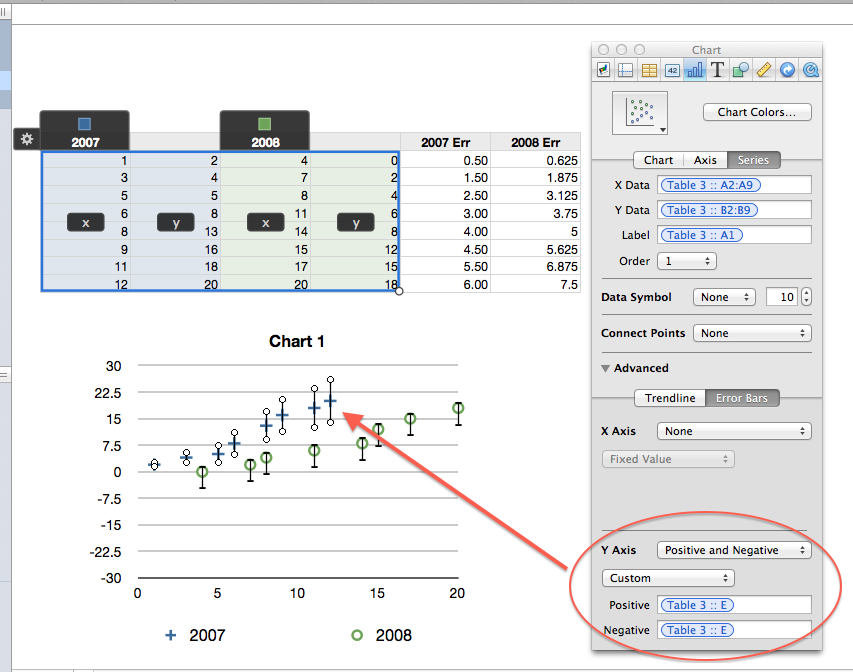
I like to use the Scatter Chart, but you will find similar controls for the bar chart.


Jerry

Standard error of mean for column/bar graphs

Welcome to Apple Support Community
A forum where Apple customers help each other with their products. Get started with your Apple ID.