HI Kristin,
I read your question earlier, and started to work on a table to answer it, but got interrupted by dinner and some chores.
While you've answered your own question, I think this might be of interest.
The paired rows are identical, with the exception of number of absences. There are two calculation of the percent score for each student, and two calculations of the average score (in the range 0 to 3). Explanations below.
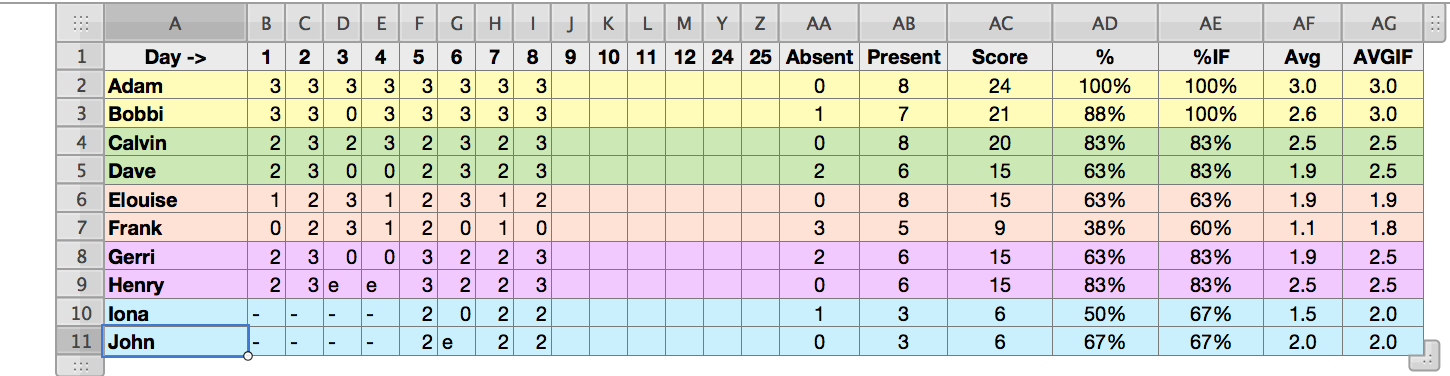
Adam is the 'perfect' student—always there, and always engaged in the class. In the first eight days, he's scored 3 every day. His score is three out of three, or 100%, no matter how you calculate it.
Bobbi is just as perfect, but missed one class (due to a medical appointment, as it turns out). A straightforward calculation of her points shows 21 for the first eight days, 88% of what she could have earned if she'd been in class on all eight days (as shown in column AD). 'But,' she might say, I couldn't be here that day for a good reason. I shouldn't be penalized for that. Column AE considers only the days where the student is present (ie. where the score is greater than the zero assigned for 'Absent,' and Bobbi was 100% on those days.
Calvin and Dave are pretty good students—average one day, superior the next. Dave was away a couple of days. Including those days in his calculations drops his percent score from 83 to 63, ignoring them keeps his percentage at 83, the same as Calvin's.
Gerri and Henry's rows introduce a new category—an excused absence, like the one due to Bobbi's medical appointment. In terms of 'bums in the seats', both have the same attendance (and both participate equally well on the days both are there). On the days they were absent, Gerri was playing hookey so she could go shopping; Henry was playing hockey with the school team, and permission to be absent had been asked for and granted before the team left for the tournament. Using a text code (e) for the excused absence, and a numerical one (0) for the unexcused makes the formula in AD ignore the excused absences, but include the unexcused ones in its calculations.
The final pair shows the case of a pair of students who entered the class several days after the rest. The days before they arrived, marked with text entries ( - ) are ignored by the formulas.
The last two columns do similar caculations to those in AD and AE, but show the results as a decimal value out of 3.
Any of the four formulas in these columns will provide you with a readable and useable result; the choice of wich to use is up to you as the teacher, and the choice depends on how you and your school want to treat absences in terms of their affecting calculated grades.
Formulas for each column are listed below.
AA2: =COUNTIF(B2:Z2,0)
Note that this counts only the absences marked with a zero. (see row 9, Henry)
To count excused absences, marked with "e", you'll need this version, placed in a different column:
Aa2: =COUNTIF(B11:Z11,"e")
For a single count including both types of absence, you could use this (see row11, John):
AA2: =COUNTIF(B11:Z11,0)+COUNTIF(B11:Z11,"e")
AB2: =COUNTIF(B2:Z2,">0")
This counts the number of days the student was present (marked with 1, 2, or 3).
AC2: =SUM(B2:Z2)
Sums the number of points earned to date.
AD2: =SUM(B2:Z2)/(3*COUNT(B2:Z2))
AE2: =SUM(B2:Z2)/(3*COUNTIF(B2:Z2,">0"))
Calculates the fraction points earned/points available, as described for the various cases above. Cells are formatted to display this value as a percentage.
AF2: =AVERAGE(B2:Z2)
AG2: =AVERAGEIF(B2:Z2,">0")
Calculates the average points per day, using 'all days' or 'days attended' as above.
Interesting exercise. Took me back to working out a similar sheet in AppleWorks (or more likely, ClarisWorks) for my own classroom several years ago.
Regards,
Barry