Here are two examples. Is this what you are looking for?
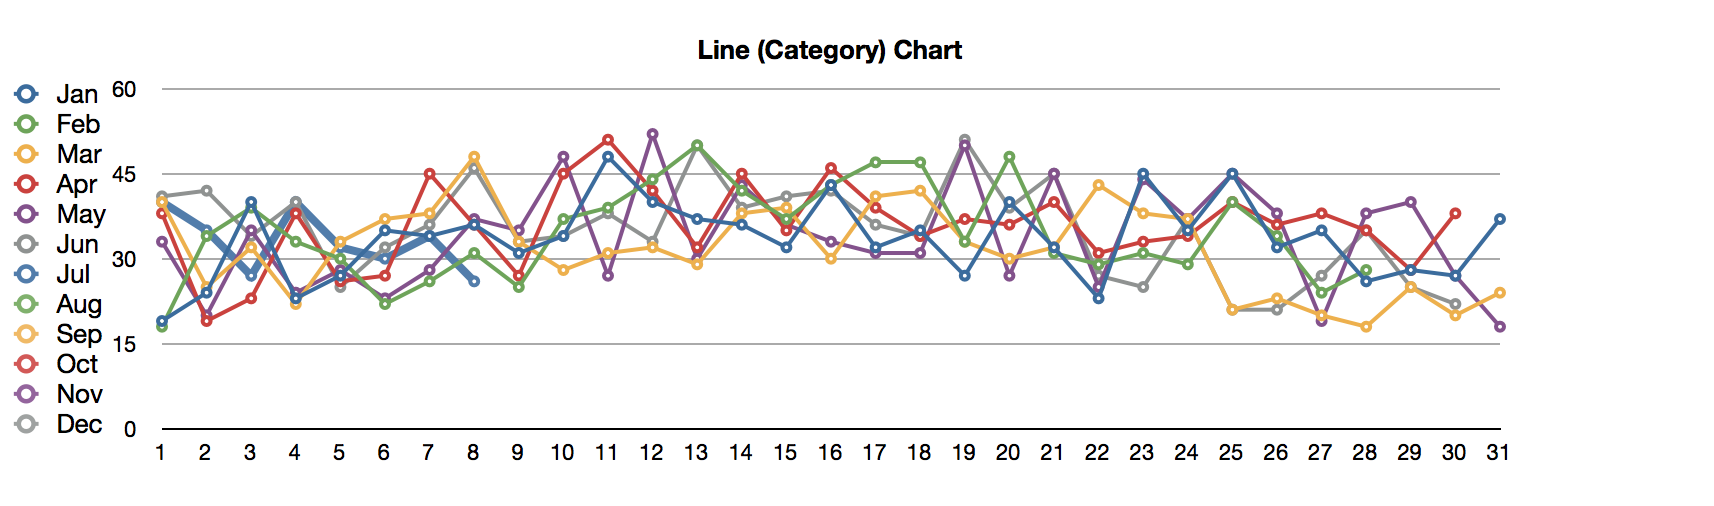
Example 1
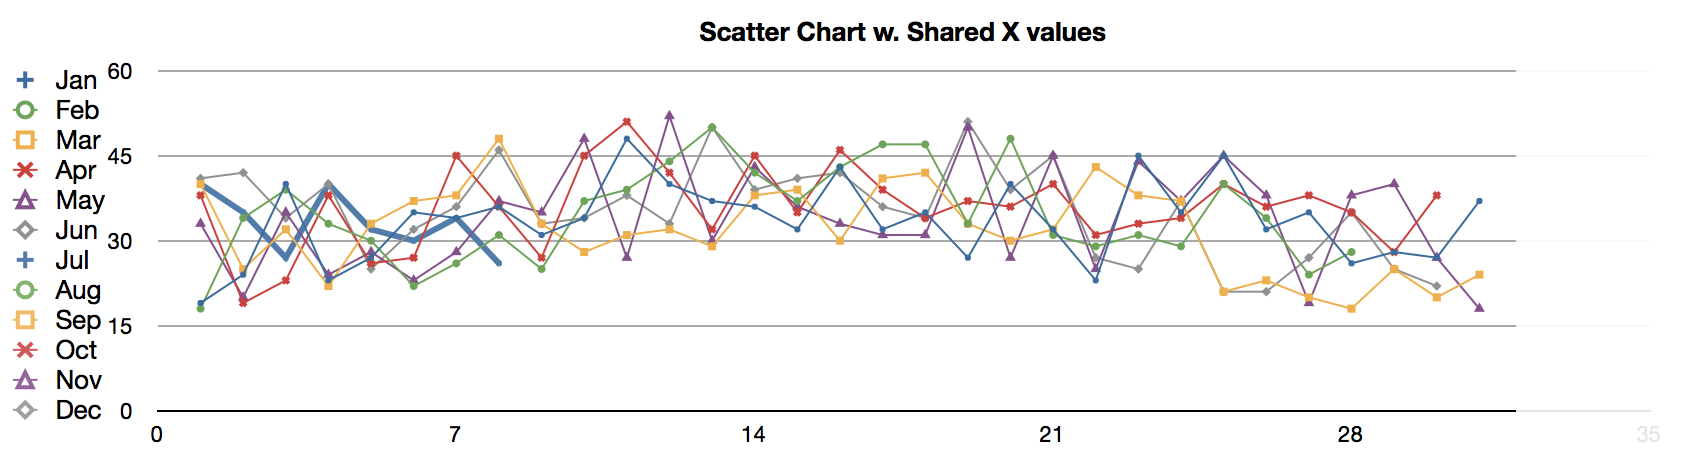
Example 2a
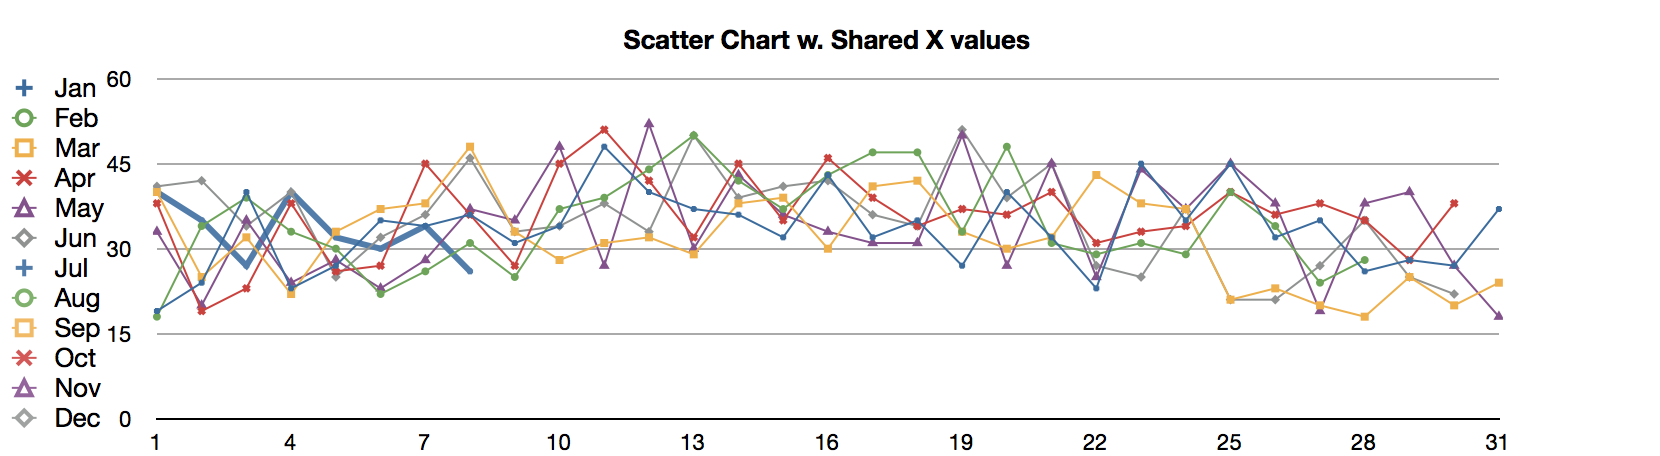
Example 2b
Both charts use the same data set (for Y values), contained in columns C (Jan) through N (Dec) in the table below.
Example 1 is a Line chart. This is a Category chart—th Y axis is a value axis, and uses the values listed in columns C through N, the X axis is a category axis, and uses the Category Labels in column A (a Header column) as category labels on the X axis of the chart. (Column B is included on the table for use in the second set of examples, and is NOT used in this chart.)
Examples 2a and 2b are Scatter Charts. Both axes are value axes. The Y values are contained in columns C through N. The X values are listed in Column B (a non-header column), and are shared by all series of Y values.
Either type will do the job you want here, assuming I've read your question correctly. The major difference between them for this task is that Category charts will place a label on the x axis for every category, provided there is room to do so.
Value axes permit up to 10 steps in the range of values shown on the axis. For a range of values from 0 to 31 (a prime number), this can be a problem. If you want to use a zero value for the left edge of the chart, you will need to use a value other than 31 for the maximum in order to get integer labels along the x axis. In example 2a, I've set the maximum to 35, the number of steps to 7, and used a borderless white rectangle to cover the right end of the chart. For the example, I've set the opacity of the rectangle to 90% to permit you to see what's being covered.
In Example 2b, I reset both minimum and maximum values for the x axis to 1 and 31 respectively. This makes it possible to show integer labels with 2, 3, 5, 6 or 10 steps. Here I've used 10 steps to show a label every three days.
Regards,
Barry
PS: Table and chart done in Numbers '09 (Numbers 2). Numbers 3 may allow more steps in the value axes.