Jo
Does it look weird? Yes?
Is it a bug? I would say "No"
Noone in these forums works for Apple so I am guessing that they are using a similar method to draw the connection as a curve that they use for the "Draw with Pen" method of drawing a line:

I drew a line using the "Draw with Pen" method on top of the points in your data (the purple line, one click for each point of your data):
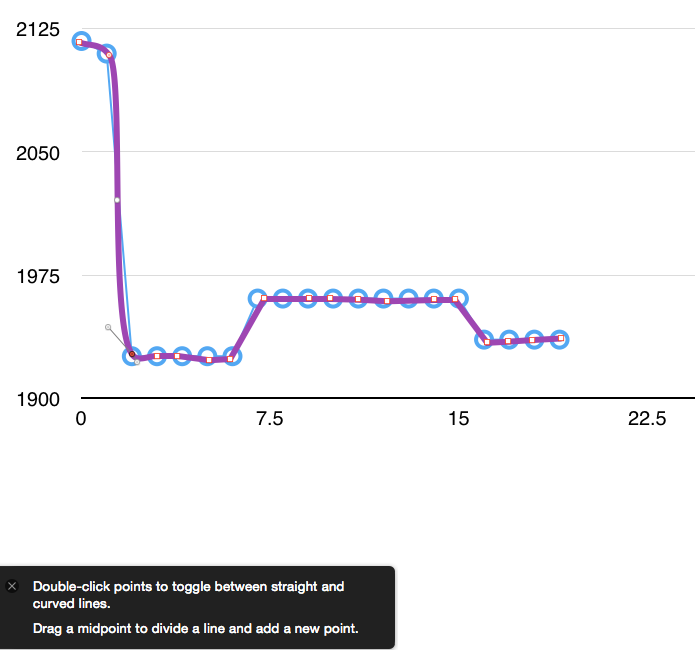
select the line, then double click the line. Each point will become a red outline with white center. The point you click change to have a red center. If you double click the point you will see little round controls with a point in the middle connected to the point with a line. You can draw those to control the slop of the curve at that point. The length of the line from the control to the point defines the weight of the slope. As you can see I can get a similar shape.
You should be careful about using a shape like this to interpolate data from discrete data. Ian suggested an average that will not show this phenomenon but will add a delay (or time shift) to the curve,