You can make a difference in the Apple Support Community!

When you sign up with your Apple Account, you can provide valuable feedback to other community members by upvoting helpful replies and User Tips.

Looks like no one’s replied in a while. To start the conversation again, simply ask a new question.

Dynamic link between sheets to add rows automatically?

I am using Numbers v12.0 build and report on event attendance. For each event I add the new rows to the Master Data sheet by copying from the .csv provided to me. Each time I update Master Data, I want the new rows to automatically appear in a table in another sheet in the same file. Think of it as linking the table with the entire table in Master Data. Today, I manually add the new blank rows, then I copy the formulas from the last filled row to the new rows.


Any guidance appreciated. Thank you!

MacBook Pro 13″, macOS 12.3

Posted on May 17, 2022 4:30 AM

Reply
Question marked as Top-ranking reply

Posted on May 17, 2022 6:09 AM

Hi,

Adding a new row in the second chart is complicated and not really needed.


Here my proposal.

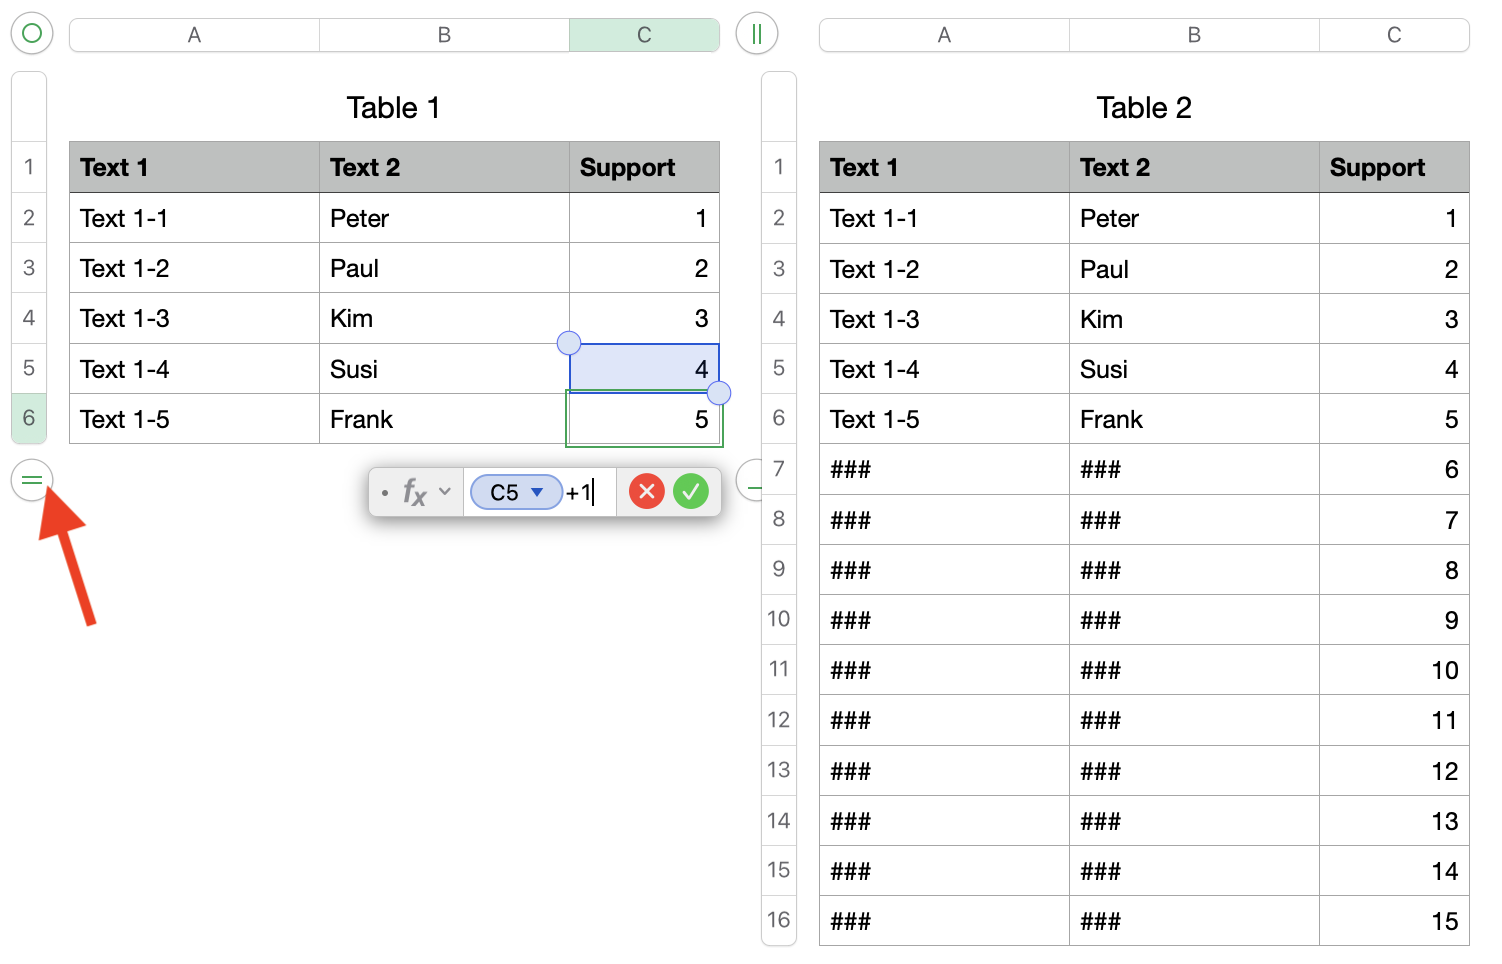
In Table 1 you will enter the data and add new rows if needed.

It has an additional column "Support", just a counter that will be increased by this formula.

As soon as you add a new row the last number will increase.

In Table 2 you use the XLOOKUP function

It will look for the value from Table 2 C2, it is searching in Table 1 column C, as soon as it will find it it will return the value from column Text 1 if not it will return ###

You can use ### or anything that will never be part of your inputs in Table 1!

Table 2 should have more rows than you may need, it can have hundred or a few thousand rows.
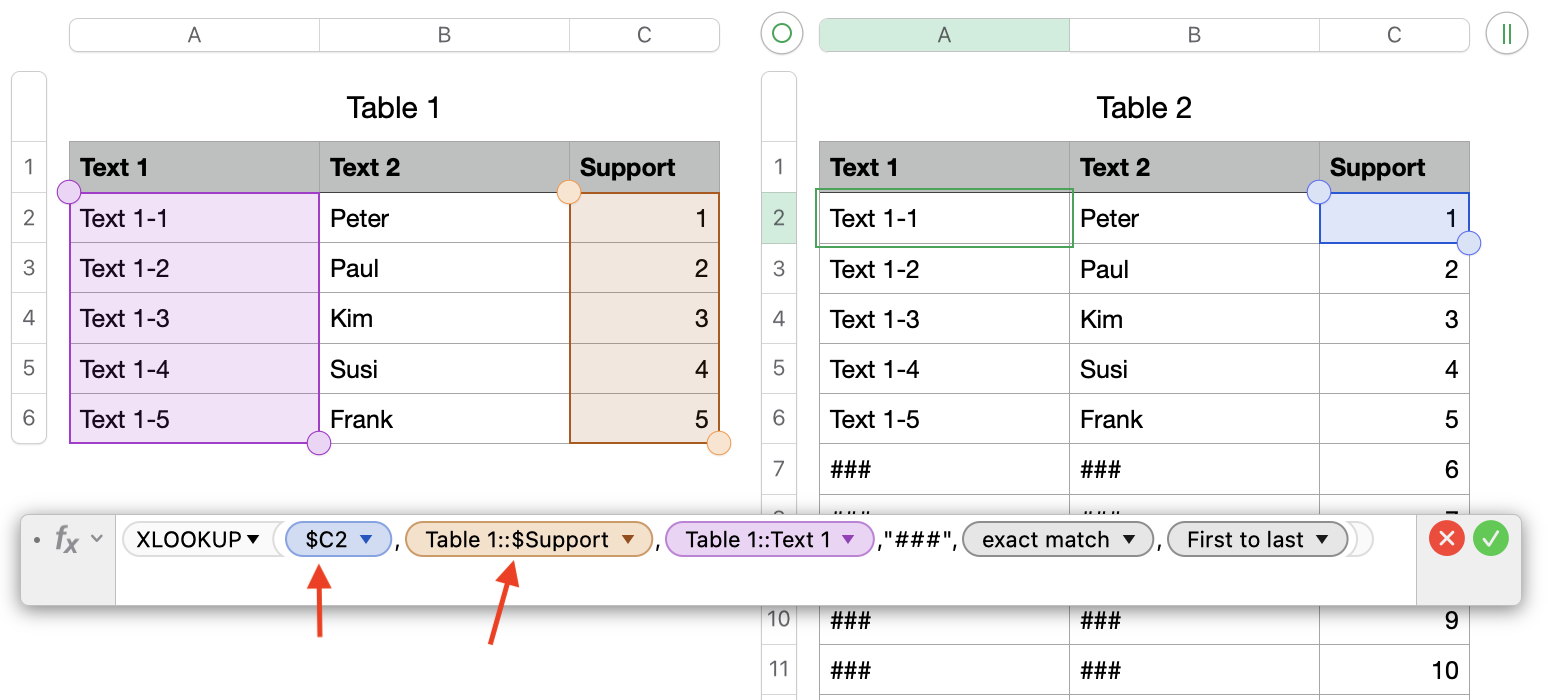
You must use $ to fixate the two columns !, this will help when you move the formula to the other columns.


Now you define a filter for Table 2 Text 1.

This filter will only show rows if the text in Text 1 is not ###, therefore it is important that you pick something that will never be in your inputs!
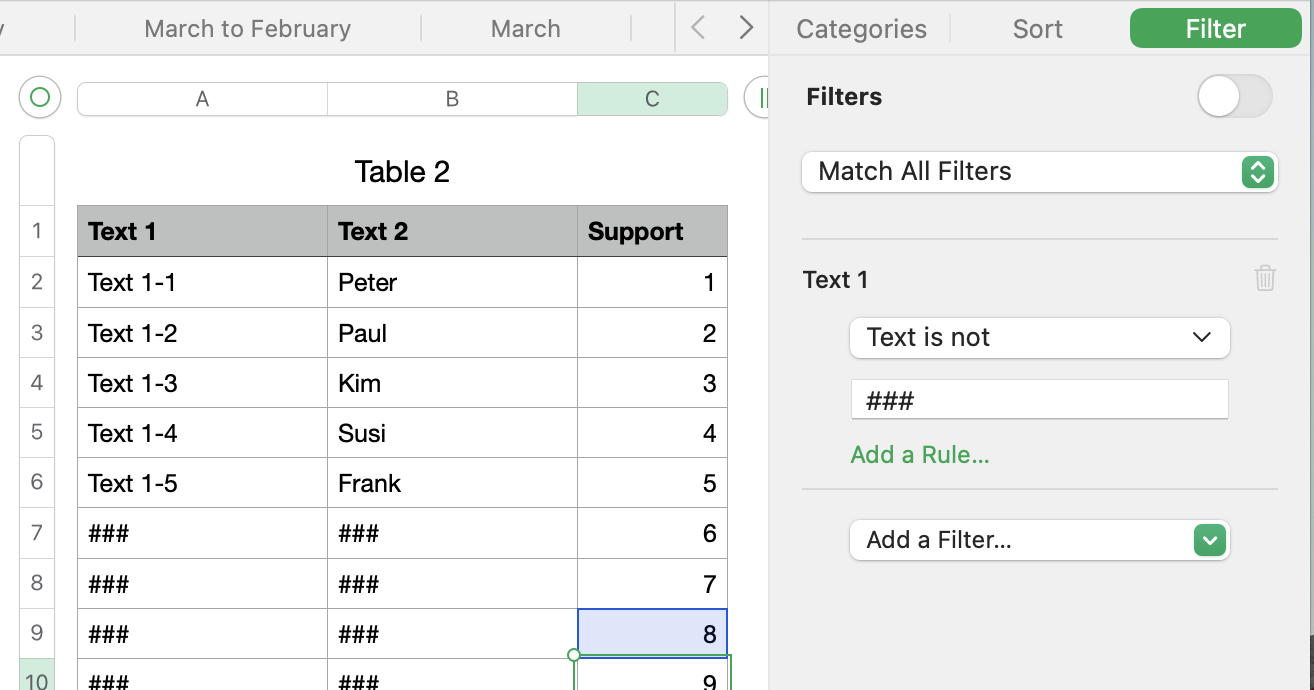


As soon as you add a new row in Table 1 you will also have a new visible row in Table 2.


Hope that will help you, let me know if you need additional support

If you don't like the column Support you can hide it, you can also pick a different location for it ;-)


Ralf

Similar questions

2 replies
Question marked as Top-ranking reply

May 17, 2022 6:09 AM in response to dahoffma95

Hi,

Adding a new row in the second chart is complicated and not really needed.


Here my proposal.

In Table 1 you will enter the data and add new rows if needed.

It has an additional column "Support", just a counter that will be increased by this formula.

As soon as you add a new row the last number will increase.


In Table 2 you use the XLOOKUP function

It will look for the value from Table 2 C2, it is searching in Table 1 column C, as soon as it will find it it will return the value from column Text 1 if not it will return ###

You can use ### or anything that will never be part of your inputs in Table 1!

Table 2 should have more rows than you may need, it can have hundred or a few thousand rows.

You must use $ to fixate the two columns !, this will help when you move the formula to the other columns.


Now you define a filter for Table 2 Text 1.

This filter will only show rows if the text in Text 1 is not ###, therefore it is important that you pick something that will never be in your inputs!


As soon as you add a new row in Table 1 you will also have a new visible row in Table 2.


Hope that will help you, let me know if you need additional support

If you don't like the column Support you can hide it, you can also pick a different location for it ;-)


Ralf

Dynamic link between sheets to add rows automatically?

Welcome to Apple Support Community
A forum where Apple customers help each other with their products. Get started with your Apple Account.