Apple Intelligence now features Image Playground, Genmoji, Writing Tools enhancements, seamless support for ChatGPT, and visual intelligence.

Apple Intelligence has also begun language expansion with localized English support for Australia, Canada, Ireland, New Zealand, South Africa, and the U.K. Learn more >

You can make a difference in the Apple Support Community!

When you sign up with your Apple Account, you can provide valuable feedback to other community members by upvoting helpful replies and User Tips.

Looks like no one’s replied in a while. To start the conversation again, simply ask a new question.

Adding a reference vertical line

Hi, I would like to ask whether anyone can help me with my graphs. I would like to add a few vertical reference lines in my graphs, but I cannot seem to find the way in Numbers nor on web. Could you please help me? Thank you in advance.

-Ben


MacBook Air 13″

Posted on Jun 27, 2023 1:00 PM

Reply
Question marked as Top-ranking reply

Posted on Jun 27, 2023 3:04 PM

Use a scatter chart. Your X data appears to be dates (numeric) so a scatter chart will work. For a scatter chart, the X axis data should be in a normal data column/row, unlike the other charts where it should be in a header column/row. You can create connecting lines just like the line chart has. Make the X axis reference lines (vertical reference lines) on a scatter chart the same way you make the Y axis (horizontal) ones on a category line chart.


With all charts other than scatter, the X axis datapoints are text, not numerical (even if the text is numbers). There is no minimum, maximum, average, or custom number you can use to place a reference line because nothing on the X axis is numbers. If you absolutely need one on a line chart, you can draw a line and place a text box.


2 replies
Question marked as Top-ranking reply

Jun 27, 2023 3:04 PM in response to frajerr

Use a scatter chart. Your X data appears to be dates (numeric) so a scatter chart will work. For a scatter chart, the X axis data should be in a normal data column/row, unlike the other charts where it should be in a header column/row. You can create connecting lines just like the line chart has. Make the X axis reference lines (vertical reference lines) on a scatter chart the same way you make the Y axis (horizontal) ones on a category line chart.


With all charts other than scatter, the X axis datapoints are text, not numerical (even if the text is numbers). There is no minimum, maximum, average, or custom number you can use to place a reference line because nothing on the X axis is numbers. If you absolutely need one on a line chart, you can draw a line and place a text box.


Jun 27, 2023 10:36 PM in response to frajerr

Hi Ben,

here is a second option.


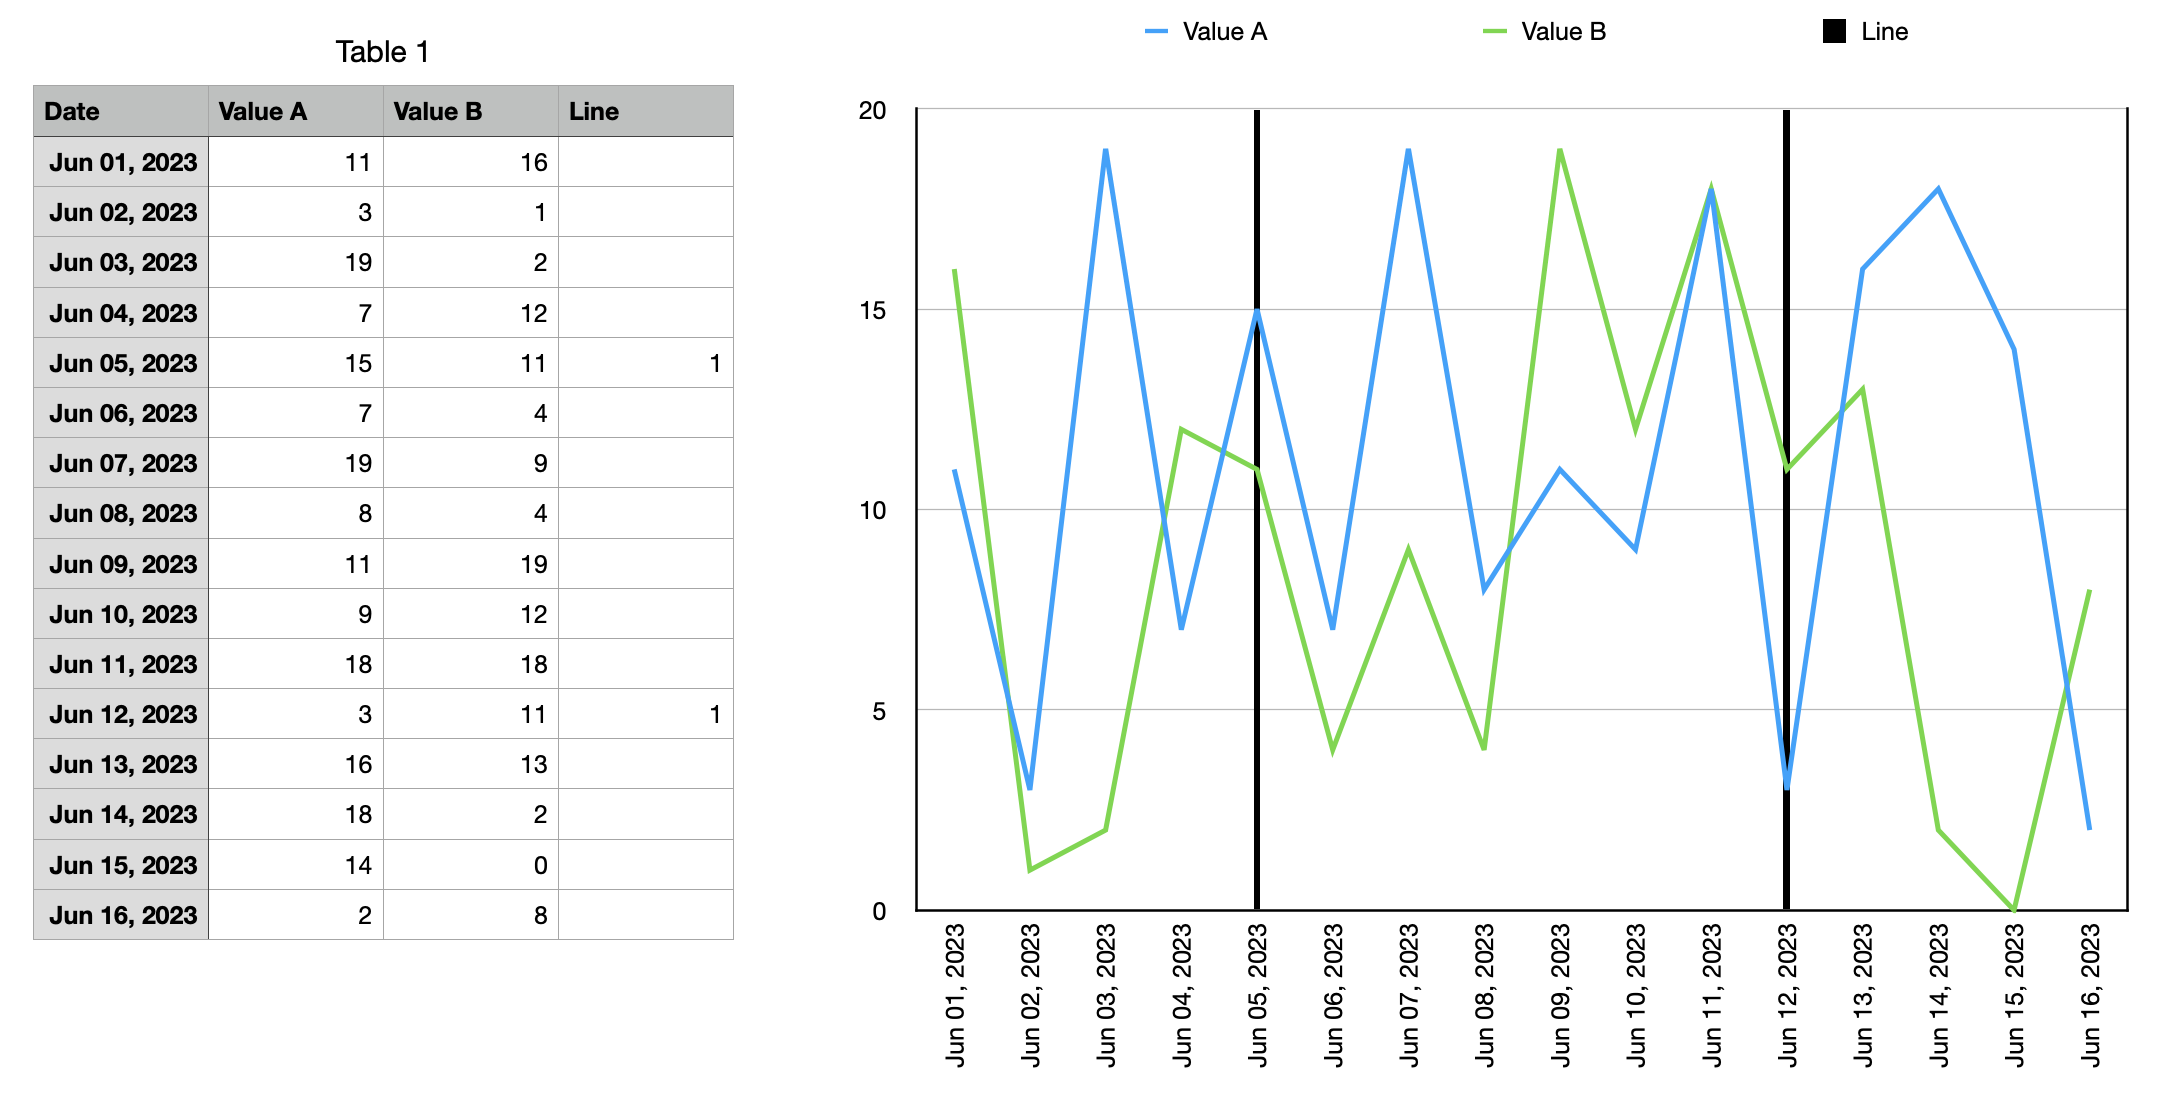
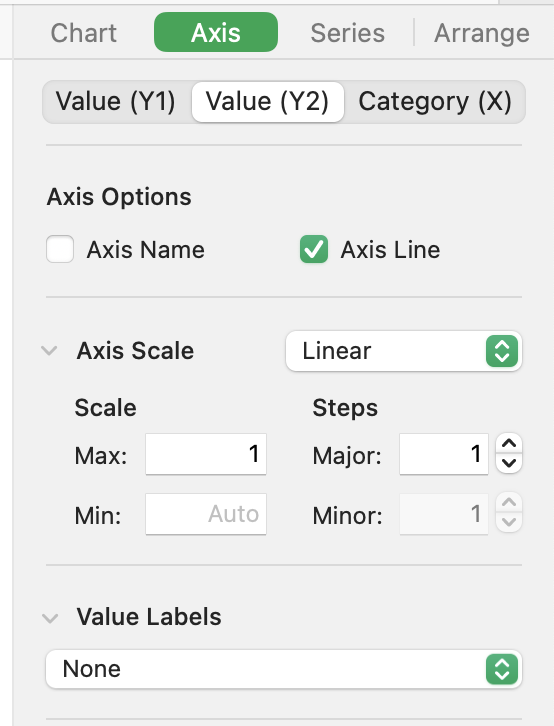
Use chart type 2D 2-Axis

Add a column for your vertical lines, I normally use a value of 1 for the lines. You can pick what you want, you can also use different values for different lines.

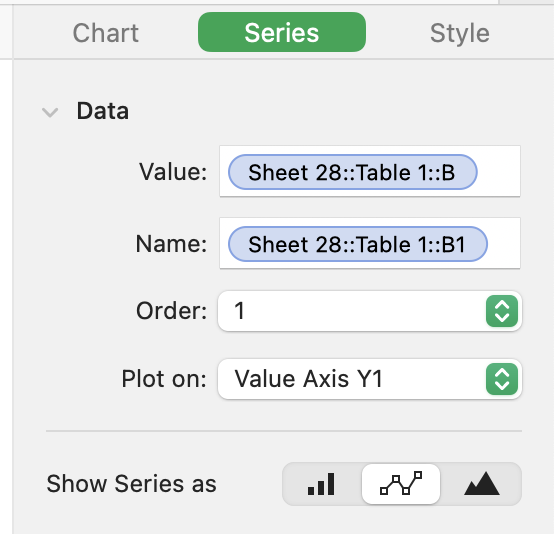
Select Plot on: "Value Axis Y1" for all your data, also select line graph

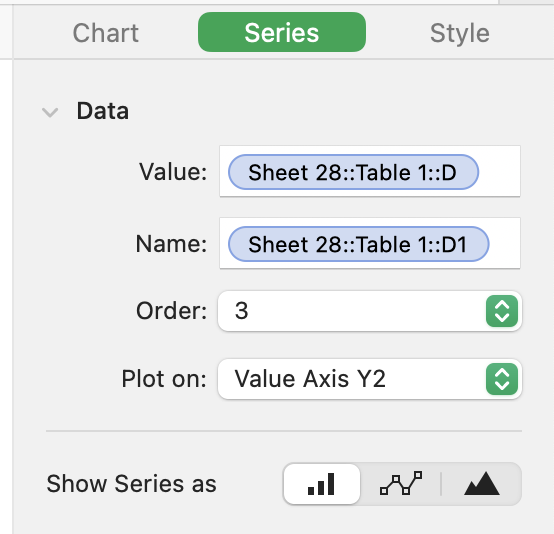
Select Plot on: "Value Axis Y2" for all your vertical lines, also select column chart

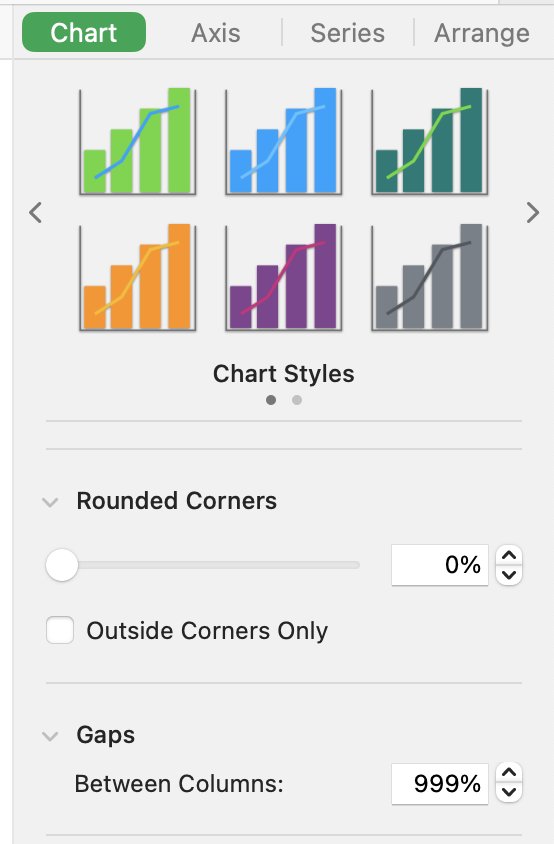
With Gaps Between Columns you can control the thickness of your vertical lines.

You can also pick the color if you change the style for these column charts.

Check that the max scale for Y2 is set to the same max as you have used in your table.

There are other options, some are maybe easier, but this has helped me in a few cases.


You would have to add your text in a separate text box.


Regards Ralf

Adding a reference vertical line

Welcome to Apple Support Community
A forum where Apple customers help each other with their products. Get started with your Apple Account.