Hi Ben,
here is a second option.
Use chart type 2D 2-Axis
Add a column for your vertical lines, I normally use a value of 1 for the lines. You can pick what you want, you can also use different values for different lines.
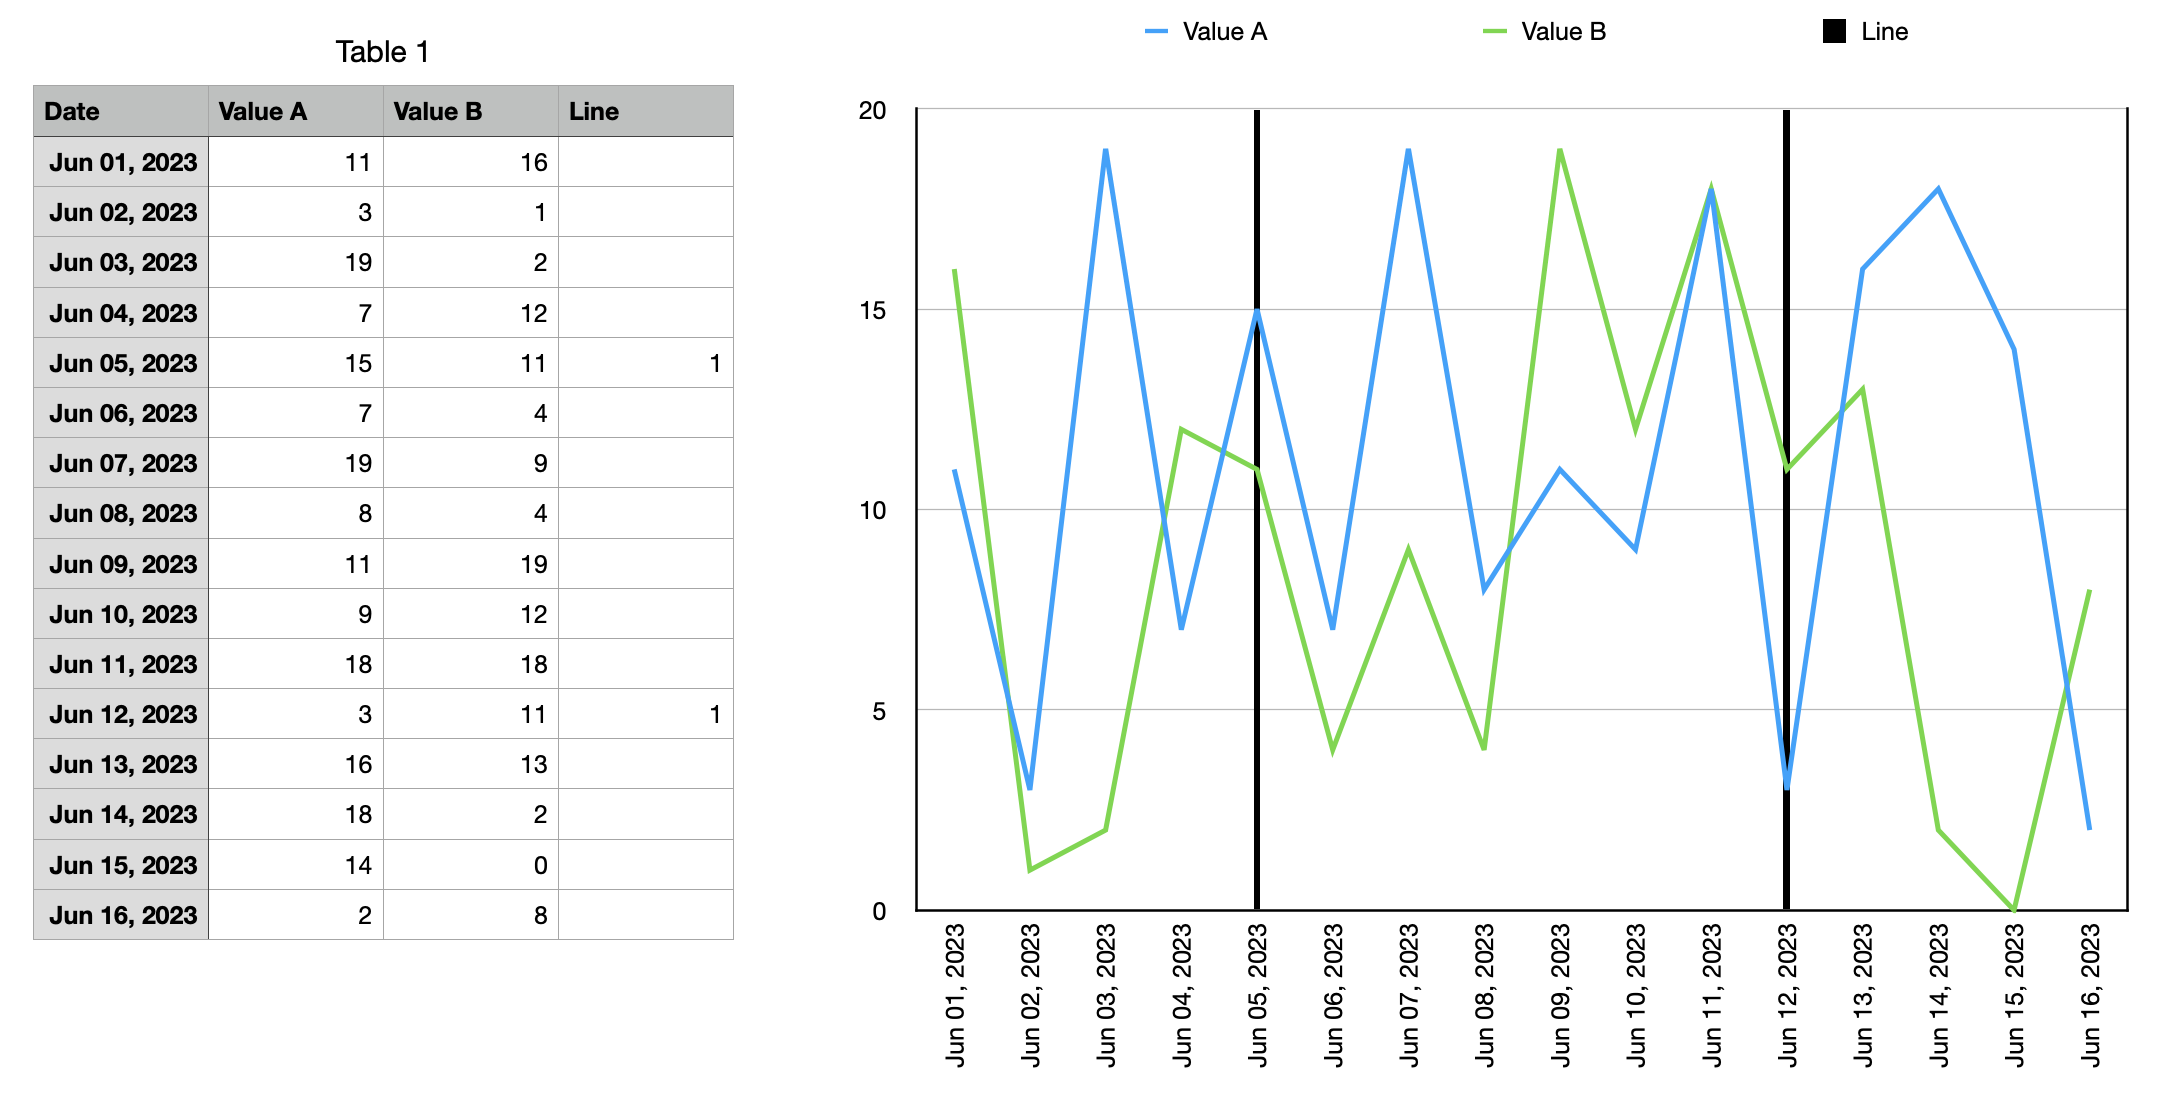
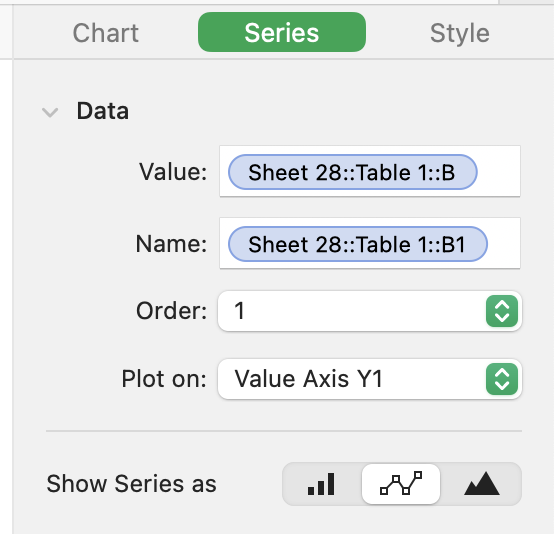
Select Plot on: "Value Axis Y1" for all your data, also select line graph
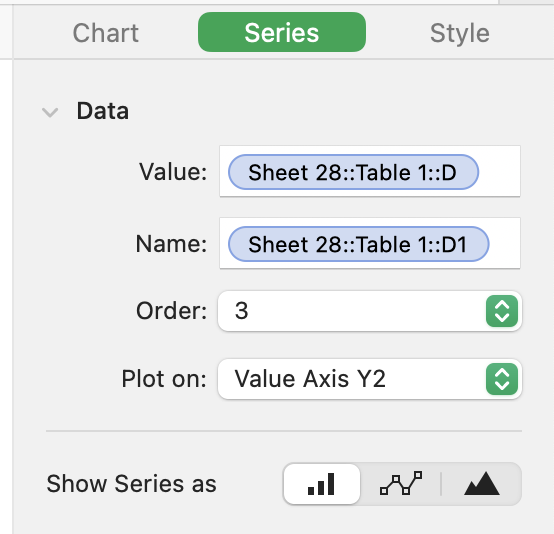
Select Plot on: "Value Axis Y2" for all your vertical lines, also select column chart
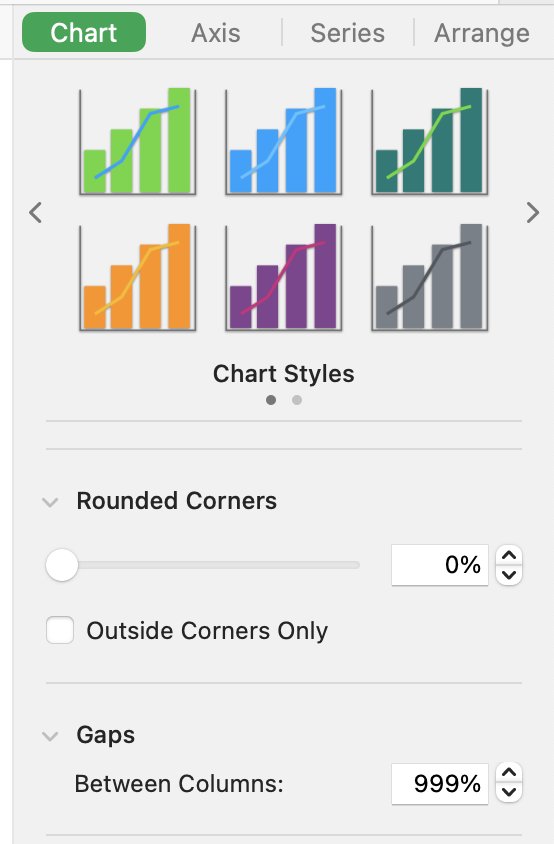
With Gaps Between Columns you can control the thickness of your vertical lines.
You can also pick the color if you change the style for these column charts.
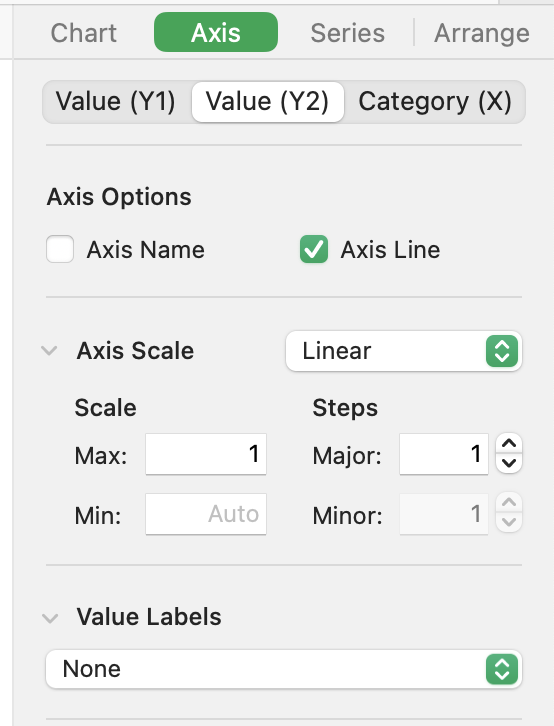
Check that the max scale for Y2 is set to the same max as you have used in your table.
There are other options, some are maybe easier, but this has helped me in a few cases.
You would have to add your text in a separate text box.
Regards Ralf