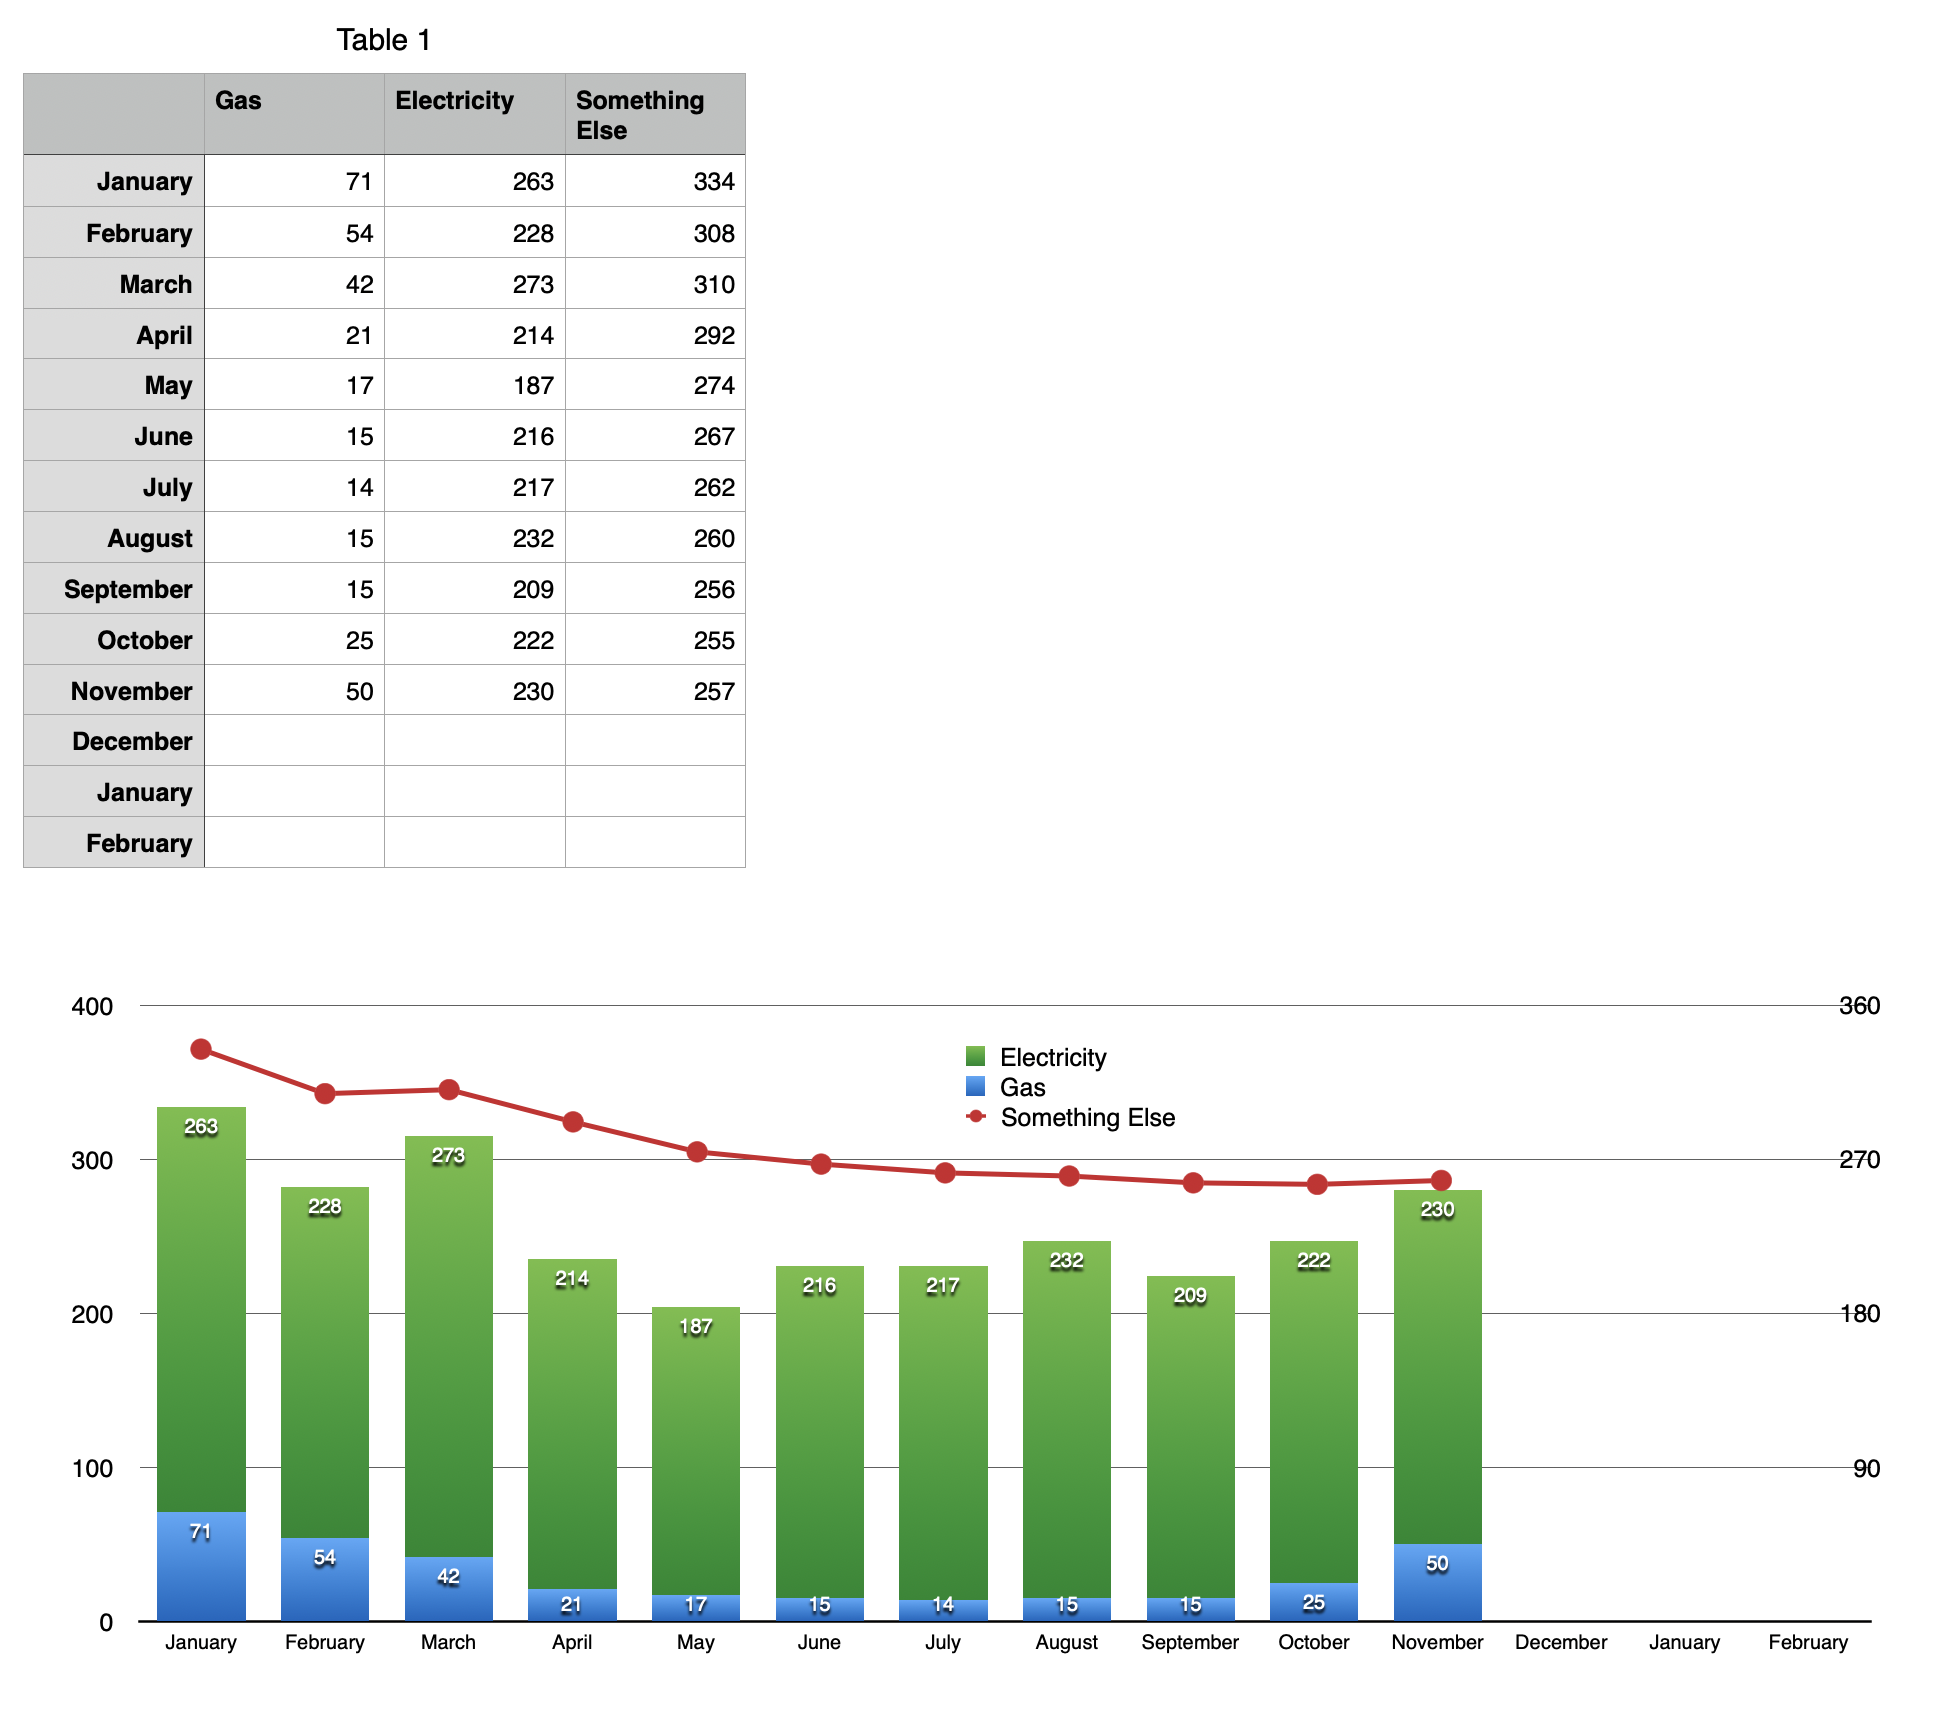
If you need a right-side Y axis, I'm afraid it might not be all that good with the charts overlaid, either. To align the points of the line with the center of the bars, the 2-axis chart and stacked bar chart aren't in the exact same place on the sheet. This causes some problems with the gridlines. If you use gridlines for the stacked bar chart, they overlap with the Y axis labels on the right (as shown below). If you instead use gridlines for the 2-axis chart, they don't reach all the way to the Y axis on the left. If you chart an extra row for the 2-axis chart (and use the stacked bar grid lines) to make some extra room, the Y axis labels on the right become too far from the chart (plus you'll have to realign the charts whenever you include more data). I have not yet seen a way to make it look right.
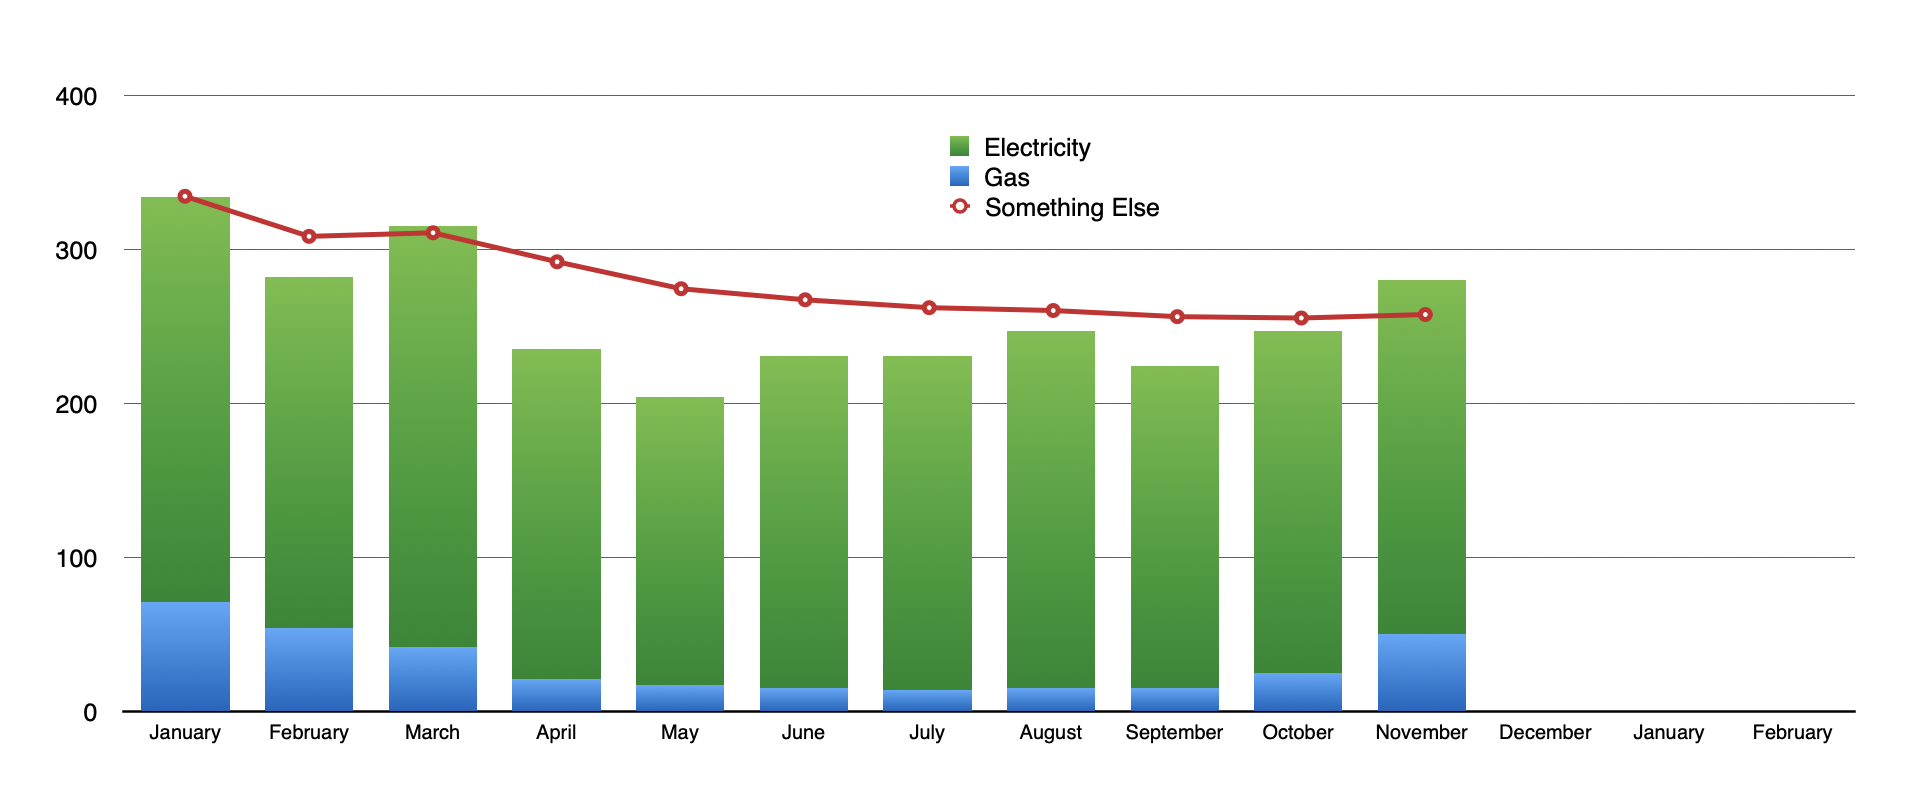
If you use normal line chart for the line so the Y axis is on the left and both charts have the same Ymin and Ymax, there is no problem: