Apple Event: May 7th at 7 am PT

Looks like no one’s replied in a while. To start the conversation again, simply ask a new question.

Averaging a List of the 10 Lowest Numbers

I have created the following formula that will average the 10 smallest numbers from a list of 20 numbers. (The 20 numbers are in date order and will change overtime.)


=AVERAGE(SMALL(Dif,1),SMALL(Dif,2),SMALL(Dif,3),SMALL(Dif,4),SMALL(Dif,5),SMALL( Dif,6),SMALL(Dif,7),SMALL(Dif,8),SMALL(Dif,9),SMALL(Dif,10))


The formula works perfectly but is there any way to shorten it? I've looked at some other discussions and it seems to be written in this longer version.


Thank you,


Charlene

iMac 2009, Mac OS X (10.6)

Posted on Aug 17, 2011 10:07 AM

Reply
Question marked as Best reply

Posted on Aug 17, 2011 10:35 AM

Here is an alternate way.

User uploaded file

In cell A1 of the table "smalls", the formula is :

=SMALL(Main :: B,ROW())

Apply Fill Down


In the cell B22 of the table "Main" (it's in a footer row)

the formula is :

=AVERAGE(smalls :: A)


Yvan KOENIG (VALLAURIS, France) mercredi 17 août 2011 19:35:07

iMac 21”5, i7, 2.8 GHz, 4 Gbytes, 1 Tbytes, mac OS X 10.6.8 and 10.7.0

My iDisk is : <http://public.me.com/koenigyvan>

Please : Search for questions similar to your own before submitting them to the community


To be the AW6 successor, iWork MUST integrate a TRUE DB, not a list organizer !

9 replies
Question marked as Best reply

Aug 17, 2011 10:35 AM in response to Leno77

Here is an alternate way.

User uploaded file

In cell A1 of the table "smalls", the formula is :

=SMALL(Main :: B,ROW())

Apply Fill Down


In the cell B22 of the table "Main" (it's in a footer row)

the formula is :

=AVERAGE(smalls :: A)


Yvan KOENIG (VALLAURIS, France) mercredi 17 août 2011 19:35:07

iMac 21”5, i7, 2.8 GHz, 4 Gbytes, 1 Tbytes, mac OS X 10.6.8 and 10.7.0

My iDisk is : <http://public.me.com/koenigyvan>

Please : Search for questions similar to your own before submitting them to the community


To be the AW6 successor, iWork MUST integrate a TRUE DB, not a list organizer !

Aug 17, 2011 10:43 AM in response to Leno77

Hi Charlene,


Here's a very short formula that will (almost) do the job.


=AVERAGEIF(B,"<="&SMALL(B,10))


It fails in cases life the one below:

User uploaded file

In this list, the tenth smallest value (59) is also the eleventh smallest value, so the formula includes that value as well.


Here's an alternate that moves the number selection and calculation to a separate table. The formula(s) used are essentially the same as yours, but split into it's component parts. Data table (Main) is the same as the one above.

User uploaded file

Formulas in the Average table:


A2 (and filled to A11): =SMALL(Main :: $B,ROW()-1)


A12 (row 12 is a Footer Row): =AVERAGE(A)


B11 is for my own checking, and shows a count of the SMALL 10 value in the Main table.

The checkbox in B1 is there to trigger a recalculation of the randbetween() function providing the 'data' in the Main table.

Both may be ignored.


Regards,

Barry

Aug 18, 2011 3:58 AM in response to Leno77

Leno77 wrote:

Barry,

I'm still trying to get this to work - I'll look at it some more later on.

Thank you for your help!

Charlene,


The average calculated on a separate table is essentially the same solution as Yvan's. The formulas look different because:

1. the calculations are on a table separate from the data, so the source table name is part of the cell reference in the formula,

2. I've started the list of 'small' numbers in row 2, so I need to use ROW()-1 where Yvan has used ROW().


The average calculated in a footer row on the main table uses a much shorter formula, but isn't able to limit itself to 10 numbers if 'small' number 10, 11, etc. have the same value. Revising the formula to use only 10 numbers in those circumstances is probably possible, but the result would be a more complex formula than the ones used in Yvan's example or my similar example.


Regards,

Barry

Aug 18, 2011 5:47 AM in response to Barry

Hello Barry


As I often wrote, I'm lazy so, I decided to use an auxiliary table with no header to spare the substraction required when there is a header.

Honestly (1), I don't know which scheme is the more efficient :

(a) the original single formula

(b) the scheme using an auxiliary table

Honestly (2) I really don't know if the scheme which average a range of ten values like the one using the table

is better than the one which you offered with your first formula. I guess that the choice would be dictated by the true problem to treat and as it's often the case we can't guess it.


Yvan KOENIG (VALLAURIS, France) jeudi 18 août 2011 14:47:22

iMac 21”5, i7, 2.8 GHz, 4 Gbytes, 1 Tbytes, mac OS X 10.6.8 and 10.7.0

My iDisk is : <http://public.me.com/koenigyvan>

Please : Search for questions similar to your own before submitting them to the community


To be the AW6 successor, iWork MUST integrate a TRUE DB, not a list organizer !

Aug 18, 2011 6:15 AM in response to KOENIG Yvan

Barry and Yvan,


Just to give you a perspective of what I'm working on. I'm modifying a golf handicap program I had previously written. You have 20 differentials (your score adjusted to the course) and need to take the 10 lowest differentials to figure out your handicap. The 20 differentials also have to be the 20 latest scores. Each time I put a new differential in, I need to eliminate the oldest one so it's easier if the listed is in date order (in order to identify the oldest one).


What I was doing was to list the 20 differentials and dates and each time I replaced a differential I would sort the Dif column by ascending and then figure out my handicap (average of 10 lowest times .96). The problem was that I would have to adjust the average formula each time I resorted since it would be remembering the previous 10 differentials.


Here's what it looked like before: (please do not comment on my high golf scores!)

User uploaded file


With your help, I can now keep it in date order. I wanted to do it this way, since other people who are not familiar with spreadsheets want to use it. Eventually I want to automate it so all they put in is their score and date and the program selects the 20 recents dates and 10 lowest differentials but that's for another day. Hopefully all this makes sense.


Thank you for your help,


Charlene

Aug 18, 2011 2:11 PM in response to Leno77

Hi Charlene,


Here's a revision that pulls the 20 most recent differentials (and the dates of each of those rounds), extracts the lowest 10 from this list, and calculated the average. The two coloured columns are needed for the calculations, but may be hidden from view.

User uploaded file

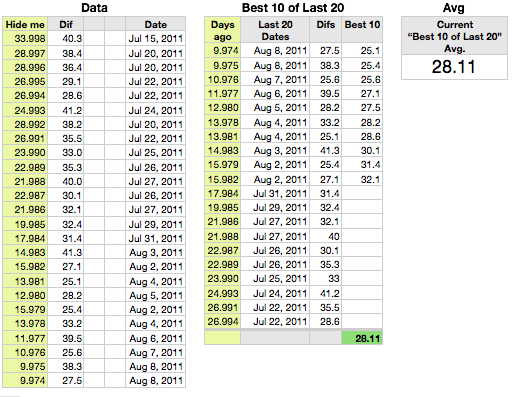
Data is a copy of your table above with an added column on the left to hold values for the VLOOKUP function(s) in the second table. Data in cloumn B is a collection of random values in the range shown in your table. Column E contains a set of random dates (generally increasing, but with some repeats and some out of order). You'll note you had a particularly golf-filled day on July 22.


A2, and filled dow the rest of column A: =DATEDIF(E,TODAY(),"D")-ROW()/1000

This uses DATEDIF to calculate the number of days between Today and the date of the round recorded on this row. The second part (-ROW()/1000) ensures that the value on each row will be unique, necessary if VLOOKUP is to find all three values for July 22 or both values for other days in the list. If more than 400 rounds will be recorded, increase the divisor, 1000, to 10000 or 100000.


The second table, "Best 10 of Last 20" collects the information from the first, and does the calculations. It is a "Sums" table (one Header Row, one Footer Row, no header columns).


A2, and filled down the rest of the column (to A21): =SMALL(Data :: $A,ROW()-1)

This collects the 20 smallest "days ago" numbers from column A of the Data table. Note that the numbers are slightly less than a whole number of days ago, due to the adjustment described above. If you want to display these, you may want to set the cell format to Number, with 0 decimal places.


B2, and filed down the rest of the column (to B21): =VLOOKUP(A,Data :: $A:$E,5,)

C2, and filled down the rest of the column (to C21): =VLOOKUP(A,Data :: $A:$B,2,)


These retrieve the date (column B) and Dif (column C) from the row of Data containing the value in column A.


D2, and filled down ten rows to D11: =SMALL($C,ROW()-1)


D12 - D21 must be empty or contain text. Text and empty cels are ignored by AVERAGE, but any numeric values in these cells will be included in the AVERAGE calculation.


D22 (Row 22 is a Footer Row): =AVERAGE(D)

The average can be calculated here, or the calculation may be done on a separate table.


The third table, Avg., is optional. Itcan be placed onto the same sheet as the Data table to display the average in a convenient place.


A2: =AVERAGE(Best 10 of Last 20 :: D)


Regards,

Barry

Aug 18, 2011 3:46 PM in response to Barry

Barry,


This is perfect!! Fantastic! (I wanted to change the rating to Perfect Answer instead of Helpful Answer)


I added a score today and it took care of eliminating an older differential in the calculation. What's great about this is I can just keep adding scores on and not worry about eliminating any of them. It will be so much easier for my spreadsheet challenged golfing friends to use.


Thank you very much for your time!


Charlene

Averaging a List of the 10 Lowest Numbers

Welcome to Apple Support Community
A forum where Apple customers help each other with their products. Get started with your Apple ID.