"Perhaps someone could take up the challenge?"
Perhaps.
What's below follows Jerry's model, but may be using different formulas.
Done using Numbers '09 (v2.3).
The model contains two tables and a horizontal bar chart.
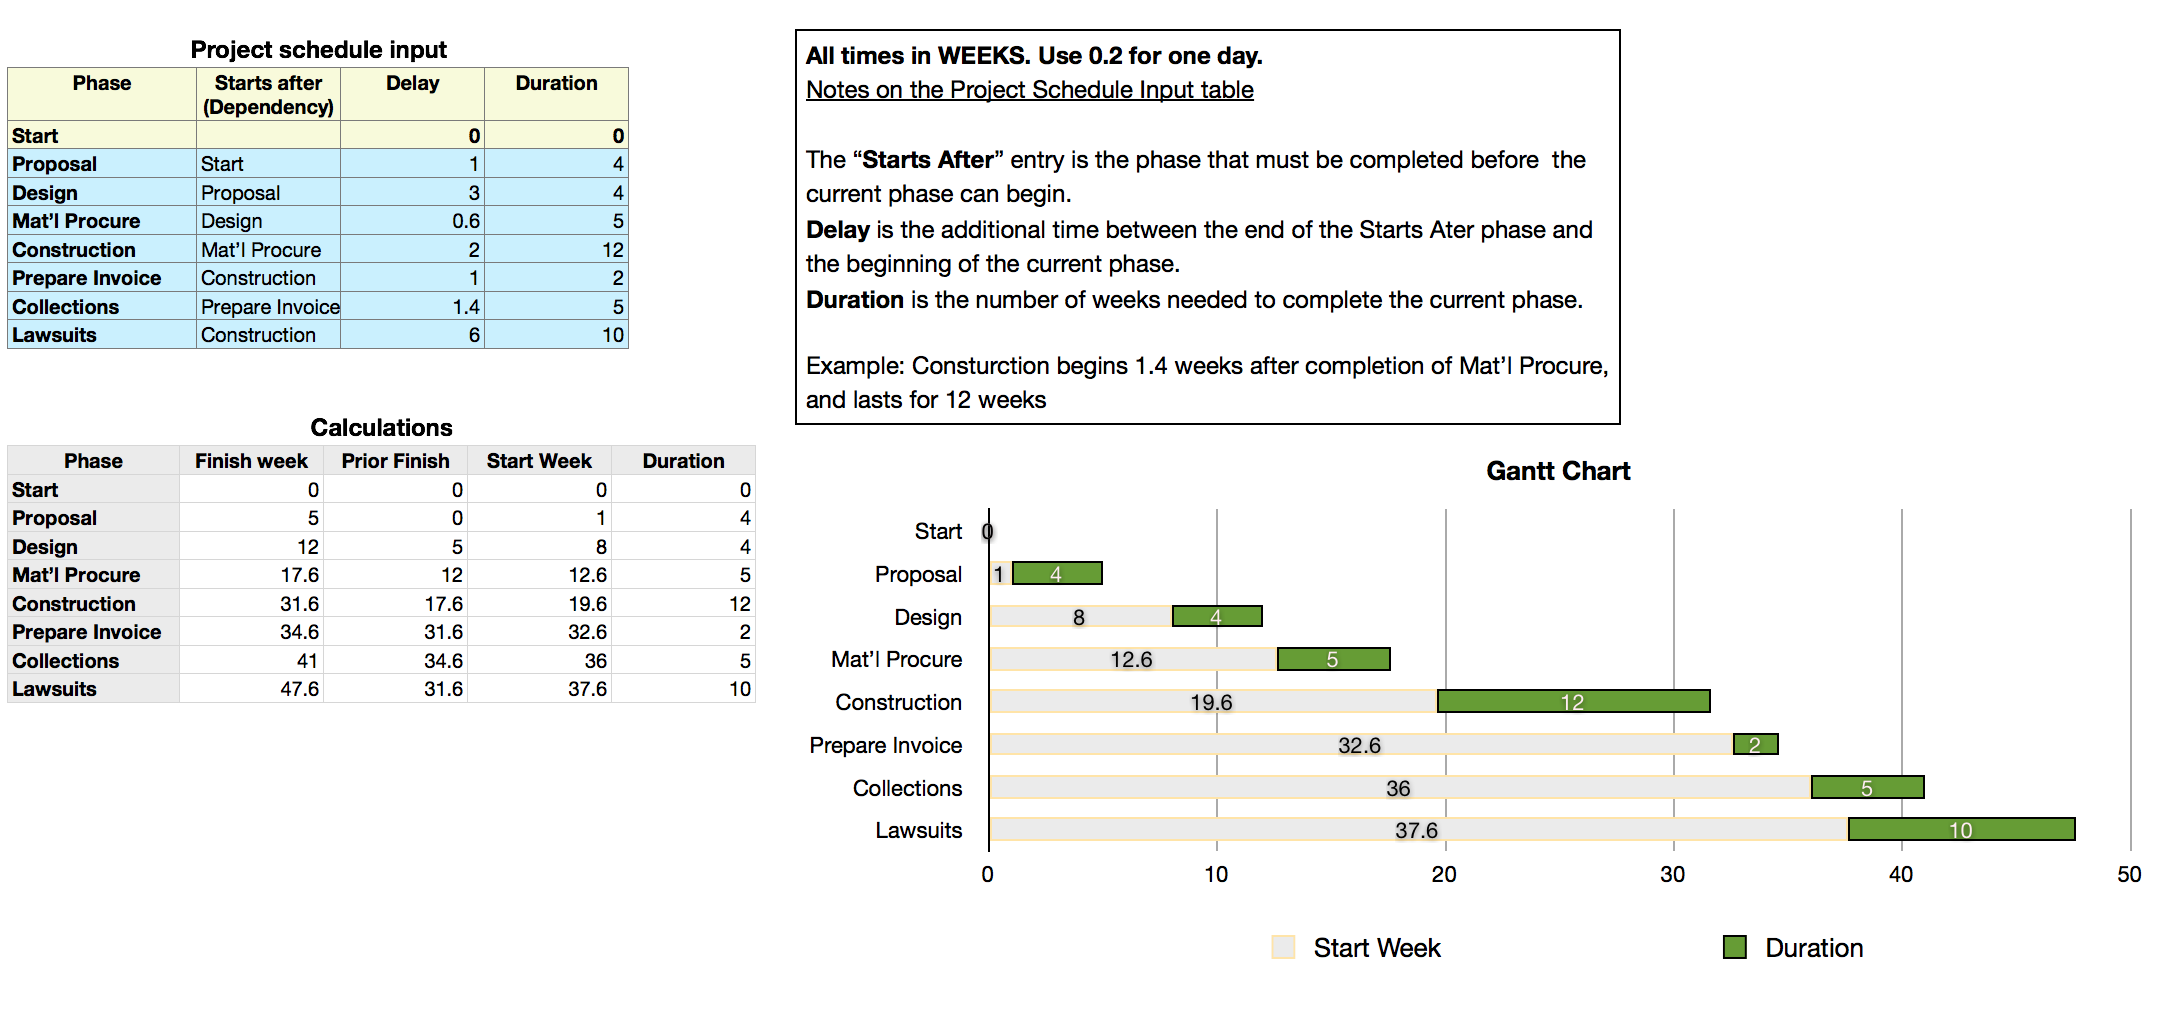
ALL data entry is done on the upper table, Project schedule input.
ALL calculations are done on the lower table, Calculations.
The Calculations table should be Locked (Arrange > Lock) to avoid accidental changes in the formulas. It will need to be Unlocked only to permit adding or removing rows to chart a project with more or fewer stages than the seven shown in the example.
Project schedule input:
Rows 1 and 2 of the first table should be the same for every project.
For each row in the blue area, four pieces of data are needed:
A: The name of the current phase. B: The name of the most recent phase that must be completed before the current phase begins, C: the number of weeks separating the end of the earlier phase and the beginning of the current phase, and D: the number of weeks required to complete the current phase.
Calculations:
Row 1 is a header row. Defining it as a header row permits two Numbers features to operate:
1. If each cell in a column contains the same formula, that formula will be automatically filled into any rows added to the bottom of the table.
2. The names of each series of values ("Start Week" and "Duration") will be automatically picked up by the chart.
Column A is a header column. Defining it as a header column permits the second feature above to apply to Phase names listed in this column.
Formulas:
Each formula is entered into the indicated cell (all in Row 2), and filled down to the last row of the table.
A2: =IF(ROW()-2>COUNTA(Project schedule input :: $A),"",OFFSET(Project schedule input :: $A$1,ROW()-1,0))
B2: =IF(ROW()-2>COUNTA(Project schedule input :: $A),"",SUM(D2:E2))
C2: =IF(ROW()=2,0,IF(ROW()-1>COUNTA(Project schedule input :: $A),"",OFFSET($A$1,MATCH(OFFSET(Project schedule input :: $A$1,ROW()-1,1),$A,0)-1,1)))
D2: =IF(ROW()-2>COUNTA(Project schedule input :: $A),"",SUM(C2,OFFSET(Project schedule input :: $A$1,ROW()-1,2)))
E2: =IF(ROW()-2>COUNTA(Project schedule input :: $A),"",OFFSET(Project schedule input :: $A$1,ROW()-1,3))
Notes on the formulas (SKIP this part if you don't care about how it works.)
Each of the formulas contains this IF statement: IF(ROW()-2>COUNTA(Project schedule input :: $A),"",XXX)
Its purpose is to prevent the calculation part of the formula (XXX) from acting in rows beyond the last row needed in the table.
XXX parts:
Columns A and E are collecting data from columns A and D of Project schedule input. Because both pieces of data come from the same row of the table, a simple offset from cell A1 will do the job. The only difference in the OFFSET part of these formulas is the last number (0 or 3), which determines the column from which the value is taken.
Column D also contains the same OFFSET section, with the column offset set to 2 (column C of the input table). OFFSET here returns the delay time between the finish of the prior phase and the start of the current phase. SUM adds this to the finish time of the prior phase found in column C (of Calculations) to get the Start week of the current phase.
Column C gets the finish time of the prior stage. This would be a very simple formula if each of the phases depended on the finish of the one immediately above it on the list, but that is not always the case, as can be seen by the last phase, Lawsuits, which depends not on the completion of the Prepare Invoice phase, but on the completion of Construction.
The XXX part of this formula is: OFFSET($A$1,MATCH(OFFSET(Project schedule input :: $A$1,ROW()-1,1),$A,0)-1,1)
The formula starts with the second OFFSET, which is the same as those above, with the column offset set to 1 (column B, 1 to the right of the base cell, A1). The result is the name of the phase on which the current phase depends. The name is handed off to MATCH, which looks for the matching name in column A (of Calculations), and returns its position in that list. -1 subtracts 1 from the position returned by MATCH, and that result s passed to the first OFFSET, where it is used as the row offset down from A1 (on calculations). The final 1 is the column offset (to column B) where the formula finds the finish time of the prior phase on which the current phase depends.
The Chart:
Select cells D2 to E9 of Calculations, then choose the 'stacked horizontal bar chart' from the Charts button menu. Select the chart, then click the colour button above each column to edit the fill and stroke colours for each section of the bars.
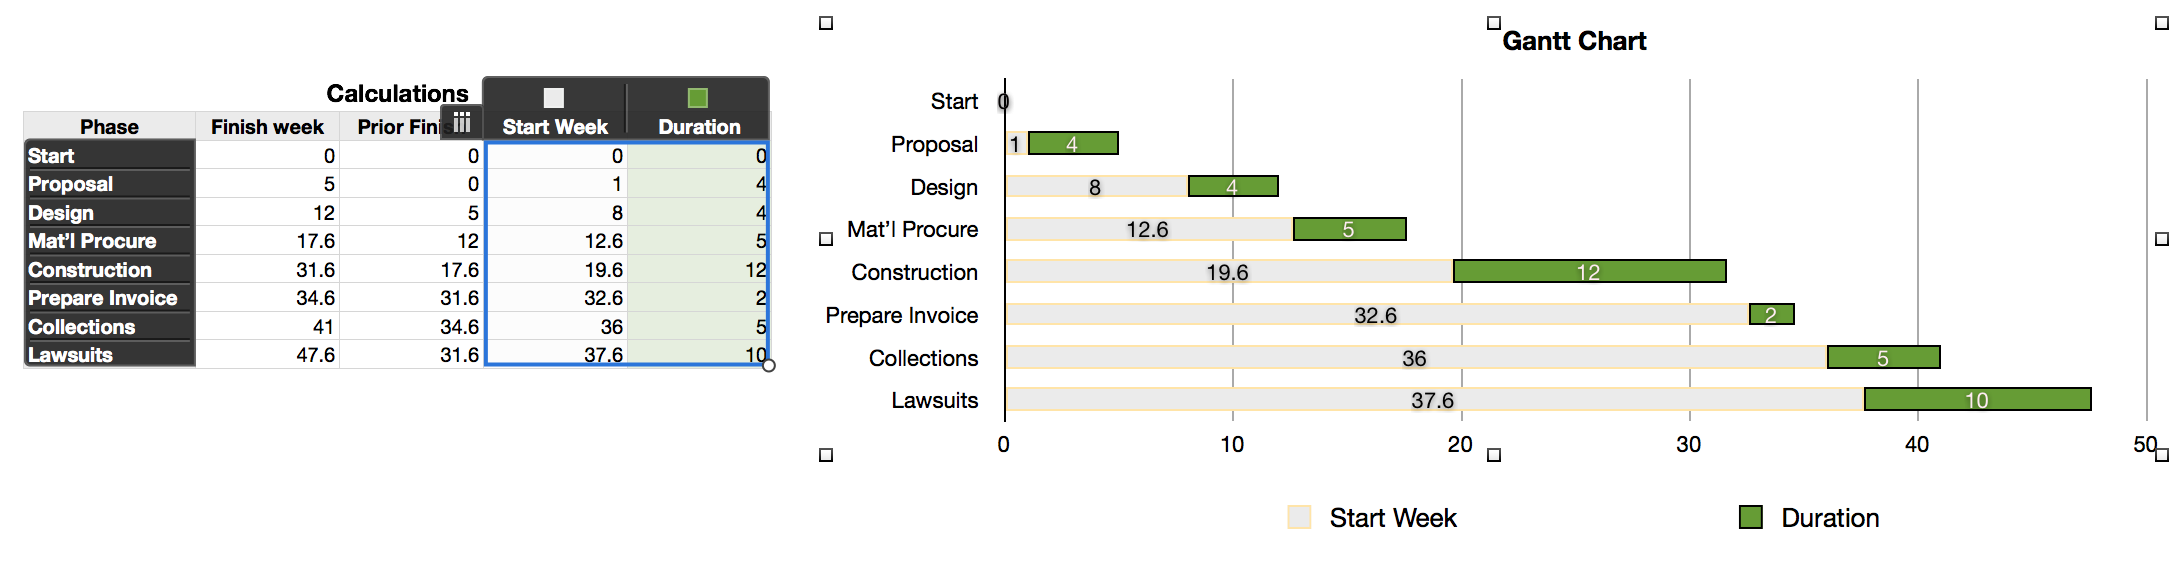
I also stretched the chart horizontally, and used the Chart Inspector to increase the number of steps on the value axis to 5 for nice round numbers, and to place the labels in the middle of each bar section.
See Jerry's post on page 2 of this thread for additional comments on this file.
Regards,
Barry
If you would like a copy of this file, please email your request. You'll find my address in my profile.
B