Of course -
So I first discovered the feature in the context of a spreadsheet that tracks my (cycling) racing form over the course of a season (which is a function of your fitness and your body's fatigue from training). In the Numbers 2.3 version of the spreadsheet, there is one table that calculates each of these values for every day of the season (as the values depend on the previous days results). I was able to then pull discrete sections of the table for use in different charts (e.g., form over the last month, racing form from 1 week in the past through 3 weeks in the future, form over the entire season) without having to have duplicative copies of the table...
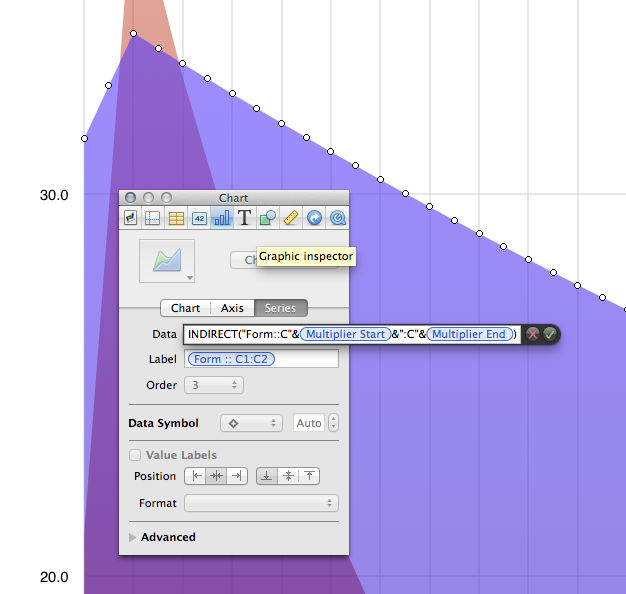
Did this using an INDIRECT function call entered into the DATA field specifying the range of cells to use for the charts, e.g.:

This will dynamically re-generate the chart based on the range of defined as Form::C_:C__ (Multiplier Start is poorly named, and is a cell defining the row corresponding to the first day of the month; with Multiplier End defining the row for the last day of the month). This lets you have the chart automatically refresh when, say, you tell it to show you the form results from November instead of October.
(edit:) As a workaround in Numbers 3, before I reverted to 2.3 for this sheet, I had to create separate tables for every instance of the chart referencing the appropriate values from the main (calculating) table. But this was obviously much much more inefficient, and required several dozen more calculations per refresh of the spreadsheet.