Looks like no one’s replied in a while. To start the conversation again, simply ask a new question.

How to auto fill table from other tables?

In the spreadsheet here

https://www.dropbox.com/sh/17yi8zdc0y9h81k/DFaJ4mgsP6


I'd like to auto fill the table on "Sheet 1" with corresponding values from the other three tables. There is a 1-1 mapping for day.


Having all three tables merged into one table will allow me to chart them in one chart. The months are ongoing so new months will be added. I'd like those to auto fill as well.


Is this possible?

Posted on Feb 17, 2014 6:20 AM

Reply
7 replies

Feb 17, 2014 5:32 PM in response to 4thSpace

I see others haven't posted ideas on this.


My first reaction was why would you want to have separate data entry tables? Wouldn't it be easier to enter the sales data in one table? That would save you the trouble of having to merge data.


You can then use the built-in filtering feature to view subsets of your data by month, etc.


SG

Feb 17, 2014 7:48 PM in response to 4thSpace

Hi 'space,


Thanks for the heads-up on this thread. The dropbox-stored document came through as a folder, rather than a Numbers document. Adding the .numbers extension to the file namewas enough to make Numbers attempt to open it. Attempt being the key word here, as what opened was the "you need a newer version of Numbers to open this file.'


That suggests to me it's a Numbers 3 file, which I won't be able to open until I make the jump to N3 (and to Mavericks), which could still be a while.


Looking at SG's pasted version of the tables, my initial impression is the same as his—What's gained by having each month's data entered on a separate table, then combined into a single table? As you appear to be makiing a single entry for each day, a 13 column by 32 row (or 32 column by 13 row) table is sufficient to capture the data and include a header row and header column for labels. Adding a footer row or a second header column (depending on the orientation of your table) would permit calculation of the monthly totals, or of daily averages for each month, on the data table.


I'm surprised SG didn't include the charting discovery he reported in this recent discussion. It seems a pretty good fit with at least one of your states goals, and looks similar enough to the situation here that it might work.


Regards,

Barry

Feb 17, 2014 8:44 PM in response to Barry

I'm not sure wh you had to add the .numbers extension. It see the extension when I click on the file (and not logged into Dropbox). It is a Numbers 5.1 file.


The file I posted is a very simple version of the real scenario. In the real scenario, each month will have many rows, which each represent a product. Products are added every month. I'm not sure that matters for this post.


I posted the simpler scenario. There is another set of data where sometimes during a month, the day will have no sales for a product. There is a gap there (no date entry since I don't enter anything for that day). Creating a summary table with days and plotting each month allows me to graph everything into one chart.


Plus, one huge table (since it will grow every month) gets unmanageable in a single sheet. I plan create a new file for each year. Thus at least 12 sheets per file.

Feb 18, 2014 12:13 AM in response to 4thSpace

"I'm not sure wh you had to add the .numbers extension. It see the extension when I click on the file (and not logged into Dropbox). It is a Numbers 5.1 file."


Probably the same thing happened in my case as caused SG to say "it didn't work into my Downloads folder".


Numbers files are actually 'packages', folders that have a flag set to make them look (and act) as files when double-clicked. Something happens to unset that flag when the package is downloaded (and the extension disappears). I guessed that re-attaching the extension would be enough to get it to act like a Numbers file. That turned out to be correct, at least in that the behaviour became the same as it would be for Numbers 2 attempting to open a Numbers 3 file.


"The file I posted is a very simple version of the real scenario. "


I suspected that was the case. Makes sense then to do the 'many into one' summary.


Assumptions:


  1. The data to be collected for the charts is the total of each column on the table for each month.
  2. These totals is in a Footer row at the bottom of the table.
  3. The number of rows in these tables may vary as products are added or removed from the listing.
  4. The Footer row is labeled with the word "Total" in Column A.
  5. The tables are named Month 1, Month 2, Month 3, etc.
  6. The Name of the month for which the table is used is shown in cell A1 of each table.
  7. The Day of month for each column is shown as a simple integer in Row 1 of eah table.
  8. Each table has only as many columns as needed to accomodate the number of days in that month.


Here's an expandable example based on those assumptions. Four month tables are shown, each with a different number of days. Two products are offered only in Months 1 and 2. Four products are added in Month 4.

User uploaded file

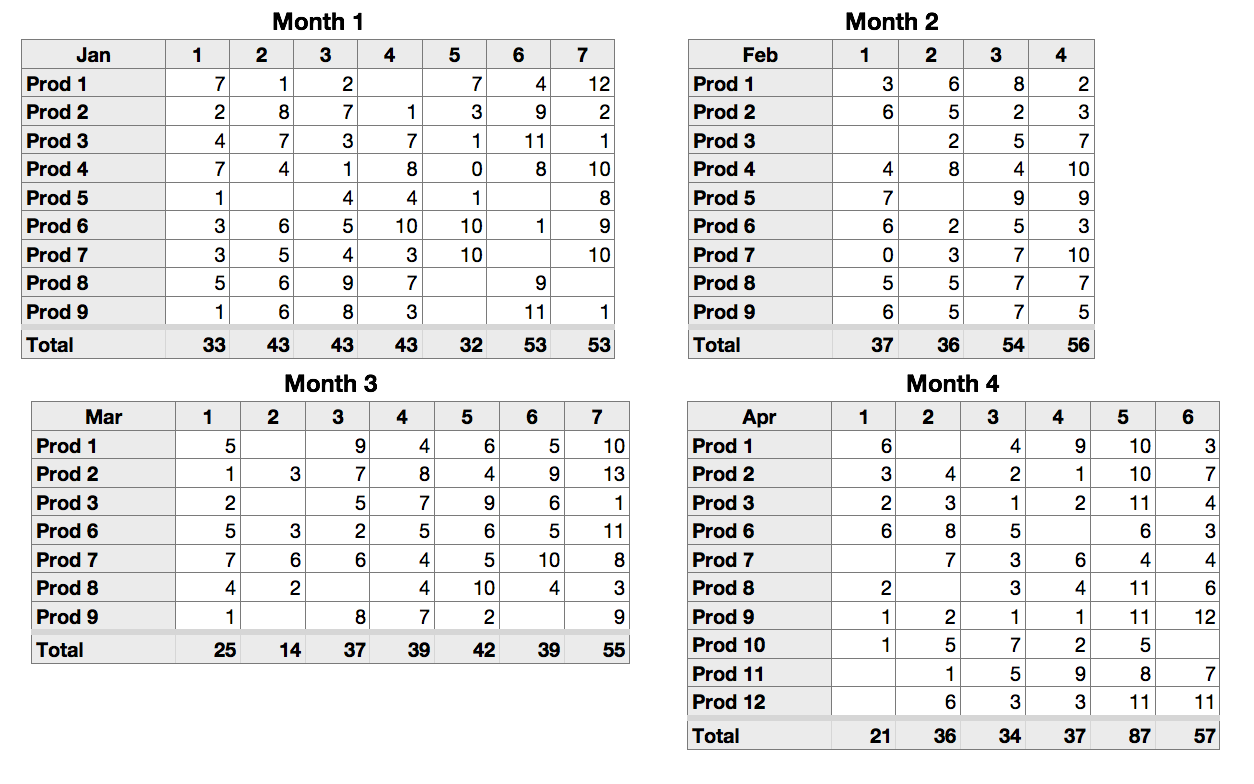
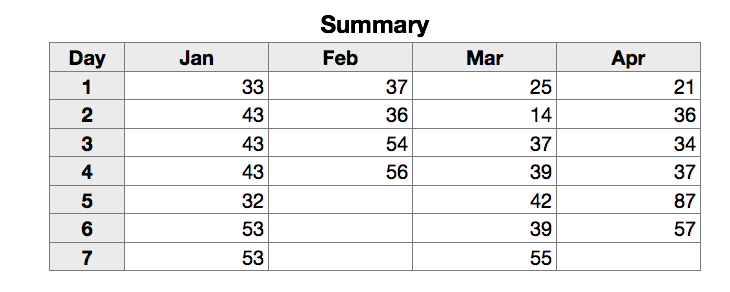
The Summary table below accomodates the changes in height and width of the Month tables.

User uploaded file

Formulas:

The values in the month tables were generatd randomly. Values calculated by the formulas were pasted into the tables in place of the formulas. Zeroes were deleted to simulate the instruction that nothing would be entered on days in which there were no sales of a specific product.


There is one formula on each Month table, entered in column B in the Footer row, then filled right:


B: =SUM(B)


Summary Table:


B1: =OFFSET(INDIRECT("Month "&COLUMN()-1&"::$A$1"),0,0)


Filled right to the end of Row 1


B2: =IF(ROW()-1>MAX(INDIRECT("Month "&COLUMN()-1&"::$1")),"",OFFSET(INDIRECT("Month "&COLUMN()-1&"::$A$1"),MATCH("Total",INDIRECT("Month "&COLUMN()-1&"::$A"),0)-1,ROW()-1))


Filled down to the last row, and right to the last column.


The part beginning OFFSET is the same formula as in B1, with MATCH(...)-1 replacing the first 0 to specify which ROW of the month table is the source of the data to be retrieved, and ROW()-1 replacing the second 0 to specify which column provides the data for that row.


The IF condition compares the row containing th formula minus 1 with the largest day number in row 1 of the table from which data is being copied, and shuts off the retrieval after the last day.


Tested in Numbers '09. All functions used are supported in Numbers 3.


Regards,

Barry

Feb 18, 2014 9:16 PM in response to Barry

The AppleScript equivalent, using a subset of Barry's data, turns out to be fairly practical. It might look something like this, with adjustments for tables located in separate sheets:


tell application "Numbers" to tell front document to tell active sheet

repeat with i from 1 to (count of table) - 1

set tableName to "Month " & i

repeat with j from 2 to count of columns of table "Summary"

set (value of cell (i + 1) of row j) of table "Summary" to value of cell j of last row of table tableName

end repeat

end repeat

end tell


This fills the body cells of the Summary Table from the "last row" of each of the Month tables. The Summary Table already has formulas in the Total row, which spring into action as soon as the script changes the values in the body cells.


User uploaded file


SG

Feb 20, 2014 10:59 AM in response to 4thSpace

After some more experimentation, it turns out AppleScript is a good solution for this:


try

tell application "Numbers" to tell front document

repeat with colNum from 2 to 13 --columns to fill in the Summary table

repeat with rowNum from 2 to 32 --rows to fill in the Summary table


set the targetCell to cell rowNum of column colNum of table "Summary" of sheet 1


(*

the row number in the summary table is the cell number of the summary row ("last row") in a monthly table

the column number in the summary table is the sheet number of the corresponding monthly table

*)


set the sourceCell to cell rowNum of the last row of the first table of sheet colNum


set the value of the targetCell to the value of sourceCell


end repeat --rows

end repeat --columns

end tell


on error

display alert "Oops!. Make sure your document is the front document. Also check dimensions of tables. Make sure the number of rows in the body of your summary table is the same as the number of columns in the body of your monthly tables." buttons {"Cancel"}

end try


--end of script


My setup looked like this (rows 11-29 are hidden to fit the screenshot here):


User uploaded file


A monthly table looked like this (always to 31 even if month has less than 31 days):


User uploaded file


The advantages of AppleScript here:


--It doesn't matter what you name your monthly tables or sheets. All that's needed is that the sheets be in the order of the columns in your summary cell, and that a monthly table be the first table on each sheet.


--The Summary table is refreshed only when needed. With large tables on multiple sheets, Numbers can be become sluggish with lots of formulas constantly updating.


-- Once the concept of the loop within a loop is understood (that simply tells the script to proceed down the rows of a column, then move over to the next column, etc.) the syntax seems a little more friendly than formulas with INDIRECT and OFFSET.


SG

How to auto fill table from other tables?

Welcome to Apple Support Community
A forum where Apple customers help each other with their products. Get started with your Apple ID.