Apple Event: May 7th at 7 am PT

Looks like no one’s replied in a while. To start the conversation again, simply ask a new question.

3GB Time Capsule MD033 lowers data rate down to 5Mb/s during large files transfers

Hello, guys!


My MD033 (2011) 3GB TimeCapsule lowers data rate for transfers from embedded disk down to 5Mb/s.


Is it a bug or feature?


This bug persists from early 2013. Since then I changed 2 iMac 27's and 1 iMac Retina. Exchanged my TC thrice by Apple Care coverage. Changed a patch cord running from TC to iMac twice. Problem remains. Persisted on every platform from Mountain Lion to El Capitan.

Video revealing a problem is located here: https://www.dropbox.com/s/b3ve9w53ixru5rv/IMG_0700.MOV?dl=0


Happens ALWAYS. No exclusions. SOoner or later transfer rate drops to 3-5Mb/s


NOTHING similar happens when I copy a large file from a PS located in the same network. 50-70Mb/s ever.

Time Capsule 3TB MD033 -OTHER, 2011

Posted on May 29, 2016 12:28 AM

Reply
13 replies

May 29, 2016 1:20 AM in response to Alejandro_64

I just happen to be working on a thread with identical problem.


weirdly irregular throughput problem with two TCs


It starts fast and then slows to a crawl.


I did not solve it on the other thread.. so let me ask how much patience you have and ability to diagnose network issues?


I don't have a magic bullet solution.. even of silver.


(Actually a single shot from a 3030 would fix it permanently.. !!)


If you are prepared to pursue it I am happy to try..


NOTHING similar happens when I copy a large file from a PS located in the same network. 50-70Mb/s ever.

This indicates the issue is not the TC.. it is the Mac that has problems. (PS = PlayStation??)


In the Mac

You must have wireless OFF.


It is best to use ethernet setup with link-local only for IPv6 unless you require full IPv6.. tell me if that is the case.


I am doing the same thing you are. But I cannot reproduce your slowdown.


User uploaded file


Open the activity monitor and track your CPU usage. One process is hitting 30% usage during the Read.. so it is fairly high.

User uploaded file


Also check the network. Read (green) and Write (red) do make perfect scope scans.


User uploaded file


I am wondering if the TCP window is set wrongly by default in your computers.. I am using a Mac Mini i7 with SSD so it is fast albeit 2011.


It is hard while I cannot reproduce the problem.

May 29, 2016 1:25 AM in response to LaPastenague

Ran out of time.


Performance tuning the network stack in Mac OS.


https://rolande.wordpress.com/2014/05/17/performance-tuning-the-network-stack-on -mac-os-x-part-2/


Might be a bit complicated.. but worth a google to see if others have options to improve the settings.


It can also be slow disk performance in the Mac.. are you running SSD??


I cannot see the ethernet port in the thunderbolt hub so I must track down that issue.

May 29, 2016 8:51 AM in response to LaPastenague


NOTHING similar happens when I copy a large file from a PS located in the same network. 50-70Mb/s ever.

This indicates the issue is not the TC.. it is the Mac that has problems. (PS = PlayStation??

Hello!


I mean when I copy files from my old PC (misspelled above, NOT PS) to iMac via TC mentioned above transfer rate is ALWAYS fine. Never goes down.


Furthermore, on my prev iMac (non-retina, 2012 model as far as I remember) I had EXACTLY the same prob.


Both of them were equipped with Fusion Drive, so the read speed is not the prob.

Will try to reproduce what u doing later. Will report back.

May 29, 2016 2:12 PM in response to Alejandro_64

PS What is a TCP windows and how it could be checked?

TCP window is a part of the Network stack that has to do with buffering.


Mostly these things should be self adjusting but something has apparently gone wrong.


But the article I referenced has the info you require.. did you read it?


To help break it down just do the first part.. we need to see if memory buffers were starved.


In a terminal type the command, netstat -m


Here are my results.


netstat -m

329/2056 mbufs in use:

300 mbufs allocated to data

29 mbufs allocated to socket names and addresses

1727 mbufs allocated to caches

257/1934 mbuf 2KB clusters in use

0/517 mbuf 4KB clusters in use

0/72 mbuf 16KB clusters in use

7829 KB allocated to network (7.8% in use)

0 requests for memory denied

0 requests for memory delayed

0 calls to drain routines


As your system slows down please do that to see if memory is delayed or denied .. post the result as a copy and paste as I have done directly from terminal.


PS How do you take this screenshots - advice me please.

This is simple key combo.


Command + Shift +4 .. it gives you ability to select just a part of the screen. When you release the mouse key after the drag it will snap the shot and land it on the desktop.


BTW the activity monitor has much less useful info than what I posted which is from Mountain Lion.. they make all the utilities less useful as time goes on at Apple.

May 29, 2016 3:13 PM in response to LaPastenague

I have now swapped to a computer running El Capitan


And yes.. I can reproduce your problem.


User uploaded file


This is to the Gen4 TC..


but it doesn't happen to a Gen 5 TC. Just to make life really confusing.


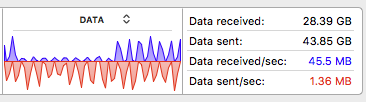
The write speed of this particular unit has always been poor but the read speed was always very good.


User uploaded file


I can see no issues in Activity monitor..

Netstat shows running on the Gen 5 is using far less resources.

netstat -m

71/1940 mbufs in use:

53 mbufs allocated to data

18 mbufs allocated to socket names and addresses

1869 mbufs allocated to caches

18/1886 mbuf 2KB clusters in use

0/538 mbuf 4KB clusters in use

0/72 mbuf 16KB clusters in use

7774 KB allocated to network (0.8% in use)

0 KB returned to the system

0 requests for memory denied

0 requests for memory delayed

0 calls to drain routines


This is on Gen4..

netstat -m

306/1967 mbufs in use:

277 mbufs allocated to data

29 mbufs allocated to socket names and addresses

1661 mbufs allocated to caches

206/1886 mbuf 2KB clusters in use

0/534 mbuf 4KB clusters in use

0/72 mbuf 16KB clusters in use

7774 KB allocated to network (6.4% in use)

0 KB returned to the system

0 requests for memory denied

0 requests for memory delayed

0 calls to drain routines

After 30min still on the Gen4.

netstat -m

480/1987 mbufs in use:

466 mbufs allocated to data

14 mbufs allocated to socket names and addresses

1507 mbufs allocated to caches

379/1886 mbuf 2KB clusters in use

0/538 mbuf 4KB clusters in use

0/72 mbuf 16KB clusters in use

7774 KB allocated to network (11.4% in use)

0 KB returned to the system

0 requests for memory denied

0 requests for memory delayed

0 calls to drain routines

And after a few more minutes.

netstat -m

1267/2061 mbufs in use:

1267 mbufs allocated to data

794 mbufs allocated to caches

1092/1886 mbuf 2KB clusters in use

0/538 mbuf 4KB clusters in use

0/72 mbuf 16KB clusters in use

7774 KB allocated to network (32.3% in use)

0 KB returned to the system

0 requests for memory denied

0 requests for memory delayed

0 calls to drain routines

Note the buffer demand is getting worse.

So.. The info I have so far is that the issue is El Capitan on older TC. (Gen1-Gen4)

It is using a lot more network resources to maintain the dataflow.

That being the case we might be able to force things to AFP and see if that helps.

No.. no change using AFP instead. After the first few reads the data speed drops dramatically.

User uploaded file

Life is not that simple however.. it seems to oscillate between slow and fast.

User uploaded file

Here is the speed as a BTW to a single disk Synology.

You can see the tail end of the test to the Gen4 TC..

User uploaded file

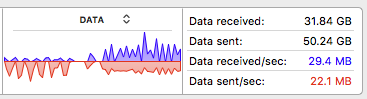
And the network buffer resources drops dramatically.

netstat -m

106/1949 mbufs in use:

80 mbufs allocated to data

1 mbufs allocated to ancillary data

25 mbufs allocated to socket names and addresses

1843 mbufs allocated to caches

25/1886 mbuf 2KB clusters in use

0/538 mbuf 4KB clusters in use

20/72 mbuf 16KB clusters in use

7774 KB allocated to network (5.2% in use)

0 KB returned to the system

0 requests for memory denied

0 requests for memory delayed

0 calls to drain routines


Jun 4, 2016 11:30 PM in response to LaPastenague

Just to confirm my results I got another Mac .. my laptop MBP 2011.. I can boot to Mavericks, Yosemite or El Capo..


The same problem showed up on el capo..


No problem at all with Mavericks.


It has been running now for 15min with no slow down.. and in fact the speed is better overall.


Both read and write manage about 40MB/s


User uploaded file


Test on Yosemite shows the issue.


User uploaded file


It did take quite a few cycles to start.. but there it is.


User uploaded file

3GB Time Capsule MD033 lowers data rate down to 5Mb/s during large files transfers

Welcome to Apple Support Community
A forum where Apple customers help each other with their products. Get started with your Apple ID.