Looks like no one’s replied in a while. To start the conversation again, simply ask a new question.

Issues setting up a Pie Chart

I am trying to create a Pie chart where % are displayed on the chart but the text associated with each number shows up in the key.

For some reason it is only displaying the first wedge color and it is taking up the whole chart.


I am clearly missing something just not sure what.


MacBook Pro 15", macOS 10.14

Posted on May 27, 2019 5:41 PM

Reply
Question marked as Best reply

Posted on May 27, 2019 6:04 PM

You've placed the numbers in a header column, where they are treated as category labels.


Do this:

  • Select the cells in column A containing numbers. Copy.
  • Click any cell in column B. Press Option-right arrow to add a new column ( C ) to the right of column B.
  • Click cell C2. Paste.
  • Click the column Reference tab for column A. Move the pointer to the right end of that tab. When a v appears on the tab, click it and choose Delete column from the menu that opens.
  • Click the column reference tab for Column A (formerly column B). Open the menu and choose convet to Header Column.
  • Select the cells in column B containing the numbers you pasted.
  • Click the Charts button and choose the 2D pie chart.


With the values now in a body column and the labels in a header column, you should get the chart you were expecting.


Regards,

Barry

Similar questions

3 replies
Question marked as Best reply

May 27, 2019 6:04 PM in response to Taneria

You've placed the numbers in a header column, where they are treated as category labels.


Do this:

  • Select the cells in column A containing numbers. Copy.
  • Click any cell in column B. Press Option-right arrow to add a new column ( C ) to the right of column B.
  • Click cell C2. Paste.
  • Click the column Reference tab for column A. Move the pointer to the right end of that tab. When a v appears on the tab, click it and choose Delete column from the menu that opens.
  • Click the column reference tab for Column A (formerly column B). Open the menu and choose convet to Header Column.
  • Select the cells in column B containing the numbers you pasted.
  • Click the Charts button and choose the 2D pie chart.


With the values now in a body column and the labels in a header column, you should get the chart you were expecting.


Regards,

Barry

May 31, 2019 9:08 PM in response to Taneria

Is column A (defined as) a Header column?

Have you selected column B as the Data column supplying data to the chart?

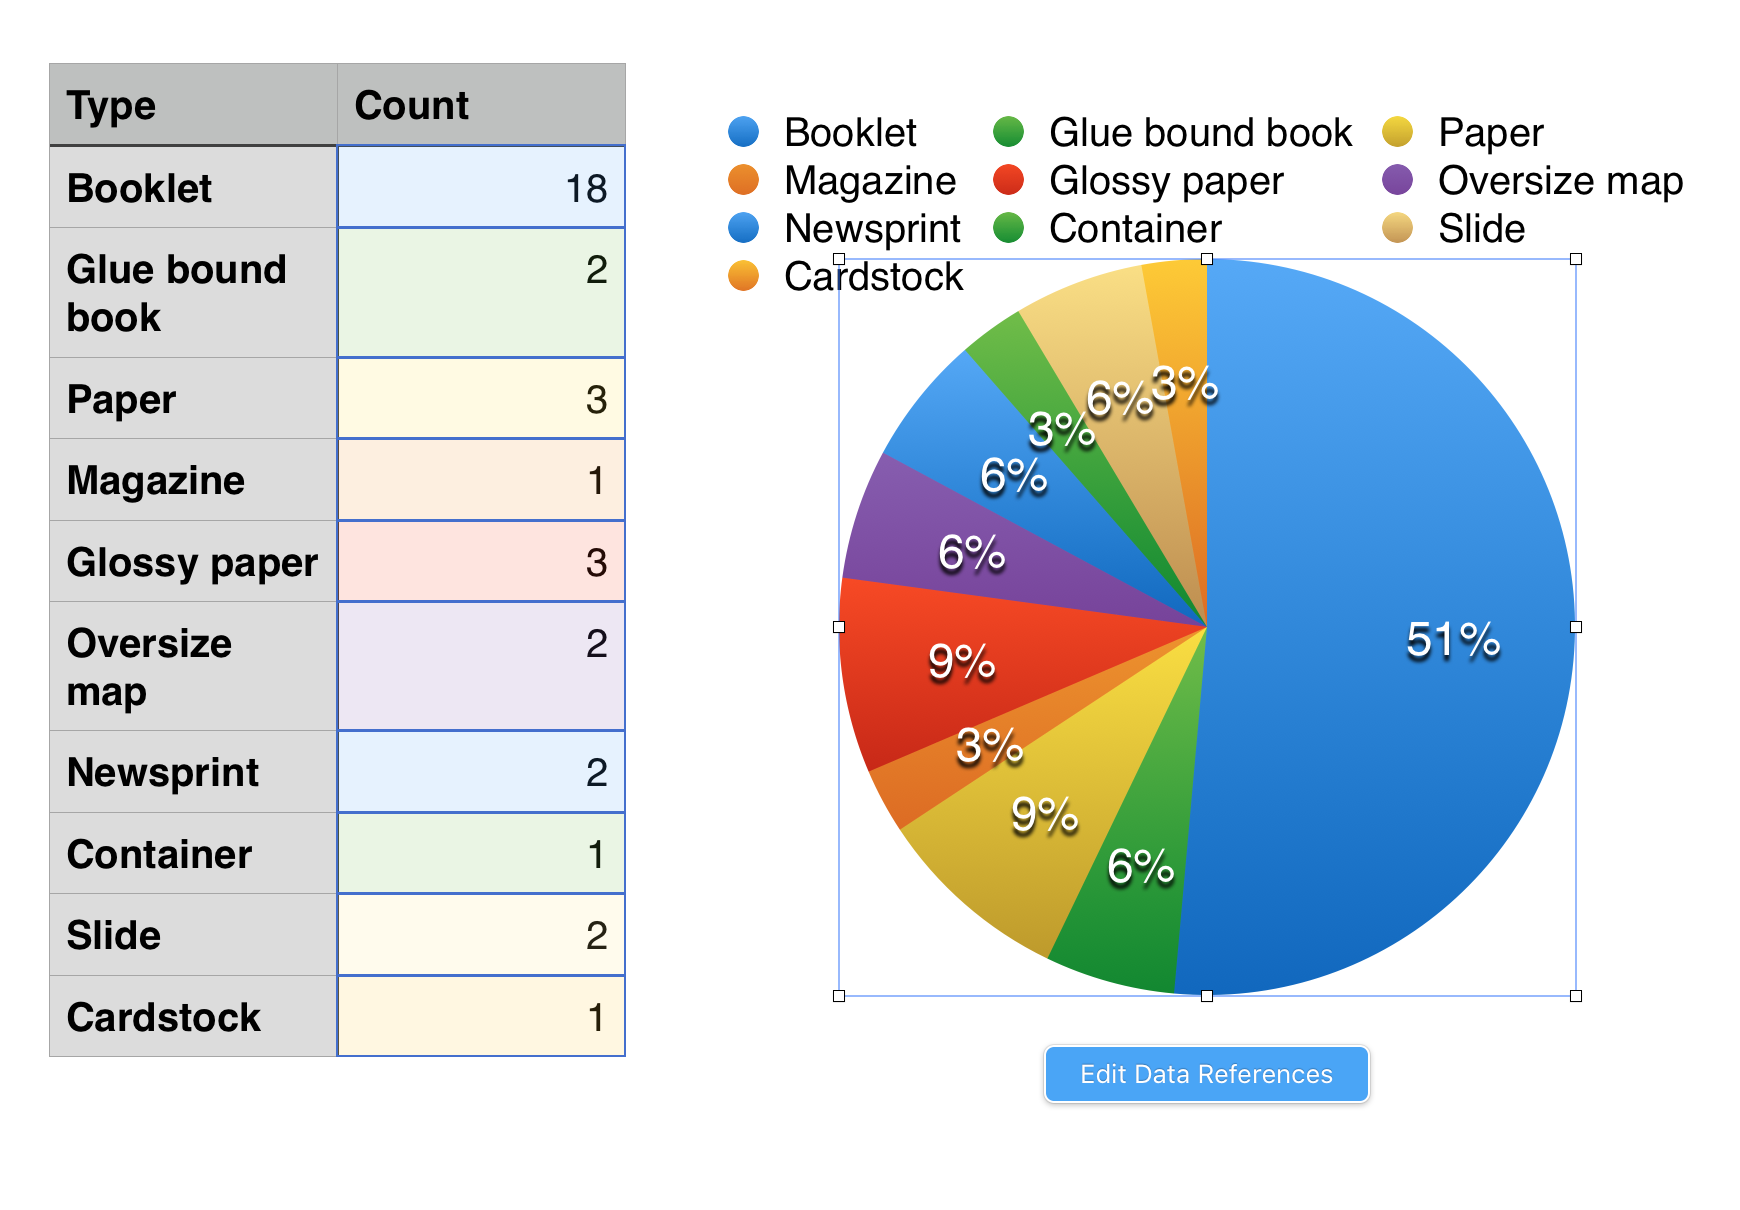
If so, your chart should look similar to this one:


To check the first question above:

  • Select the table by clicking on any cell.
  • Hover the pointer over the reference tab do column A,
  • Click the v that appears toward the right end of the tab when you bring the pointer close to that end.
    • If you see "convert to Header Column", choose it.
    • If you see "Add Header column before" and "Add Header column after", column A is already defined as a Header column. Take no action.

To check the second question:

  • Click the chart to select it
    • Do you see a blue frame around one or more cells?
      • The cells with blue borders are the cells that are feeding data to your chart.
      • If you do not see the frames around the same cells as in the example here, you have selected the wrong cells to feed information to the chart. Select the cells chown in the image above.


Regards,

Barry

Issues setting up a Pie Chart

Welcome to Apple Support Community
A forum where Apple customers help each other with their products. Get started with your Apple ID.