Sorry to hear you have a similar issue with external monitor(s). Apparently, you are not alone in this.
If after all PRAM, SMC resets, hardware diagnostics, and a fresh macOS Catalina install you did, your Mac still crashing, then it is definitely a high IO activity involved that it can’t be confirmed or seen in Activity Monitor utility alone.
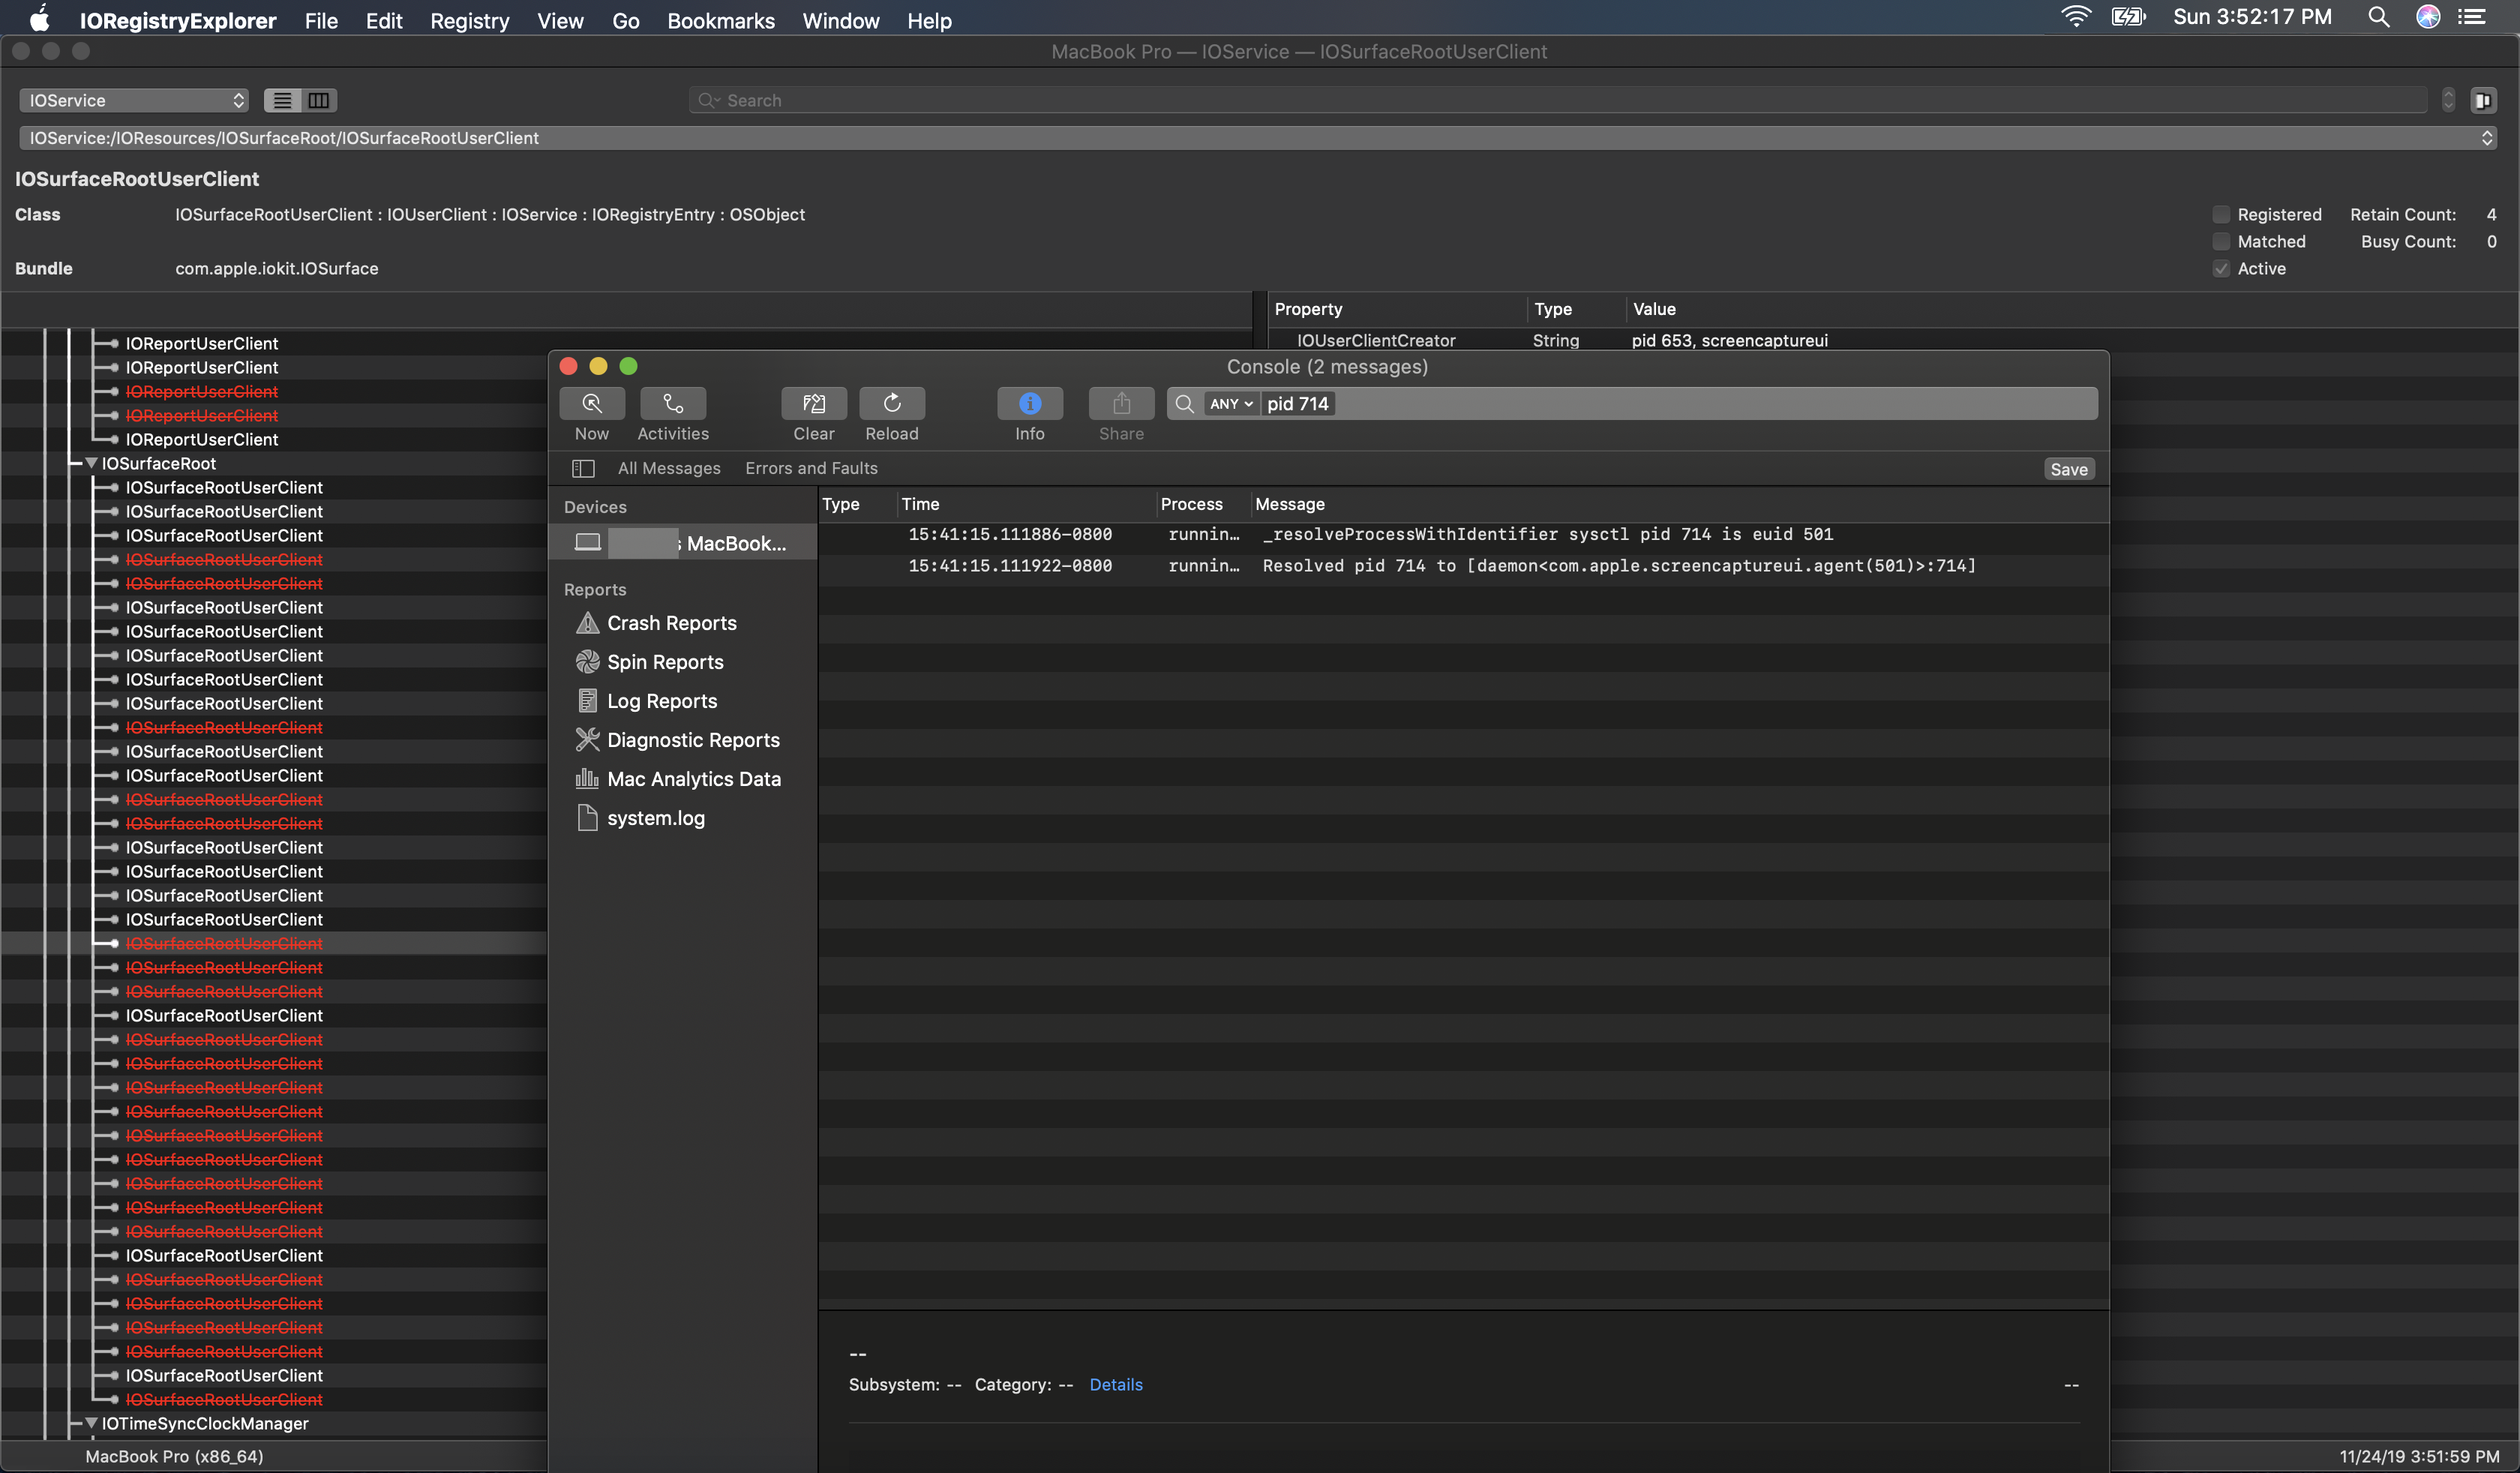
To get a live look at the way your Mac performs and how the IO commence in real time, there is a special developer tool called IO Registry Explorer. This tool is used by developers to troubleshoot issues with any hardware or peripherals your Mac utilize and interacts with. You need to create a developer account to download Additional Tools from the developer site. After you download and install Additional Tools in the Utilities folder found in Applications, launch IO Registry Explorer that you’ll find in the Hardware folder; also launch the Console utility from Utilities as well.
In the IO Registry Explorer left pane, see if there are any terminated processes. Do this without a plugged in external monitor and then with the monitor plugged in. Take a screen capture. If most of the process termination are seen in IOSurfaceRootUserClient, click on it and then get the PID # (process ID #) and search for it in the Console. It may look complicated but it is not really at all. If you see the process being terminated, crossed out and in red, then it is the video card. See snapshot below. Btw, do repeated snapshots to see if the terminated processes add up in the left pane of the IO Registry Explorer.
This pointed me to look specifically at a special crash in Console, pointed at the GPU:
"Crashed Thread: 2 com.apple.coreanimation.render-server
Exception Type: EXC_CRASH (SIGKILL)
Exception Codes: 0x0000000000000000, 0x0000000000000000
Exception Note: EXC_CORPSE_NOTIFY
Termination Reason: WATCHDOG, [0x1] monitoring timed out for service
Termination Details: WATCHDOG, checkin with service: com.apple.WindowServer returned not alive with context:
unresponsive work processor(s): WindowServer main thread
90 seconds since last successful checkin, 53 total successful checkins since load, 49 seconds since last crashed by watchdogd, (1 induced crashes)
Application Specific Information:
StartTime:2019-10-12 21:00:07
GPU:IG&AMD
MetalDevice for accelerator(0x4803): 0x7f8fced0bfc8 (MTLDevice: 0x7f8f90098000)
MetalDevice for accelerator(0x4c27): 0x7f8fced10888 (MTLDevice: 0x7f8fa00b0000)
IOService:/AppleACPIPlatformExpert/PCI0@0/AppleACPIPCI/PEG0@1/IOPP/EGP0@0/IOPP/EGP1@0/IOPP/GFX0@0/ATY,Xingu@1/AMDFramebufferVega10
IOService:/AppleACPIPlatformExpert/PCI0@0/AppleACPIPCI/PEG0@1/IOPP/EGP0@0/IOPP/EGP1@0/IOPP/GFX0@0/ATY,Xingu@0/AMDFramebufferVega10
"
Also, I sent my Mac already to Apple for repair.
