Thanks for your reply.
The scatter chart gets part of the way there but it's not easy to tell how many readings are in each category. If several readings are the same, they overlay each other showing up us darker circles.
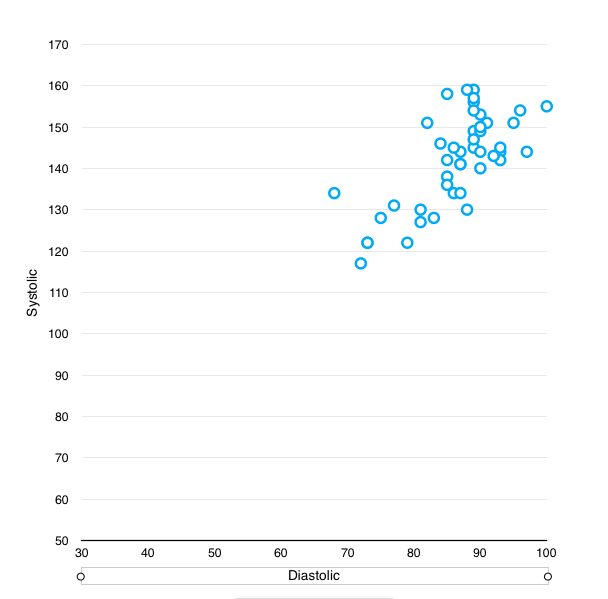
Here's a screen shot of my last three weeks data.
It's a pity that I can't add scale lines at 60,80,90 for diastolic and 80, 110, 130 for systolic.
I wondered if I could add extra columns, then generate text to say if the reading in each column was in the red, yellow, green or blue range. Then combine this text in another column using a rule such as if either is red then the result is red, if either is yellow the result is yellow, if both are green the result is green, otherwise the result is blue. But this seems so cumbersome.