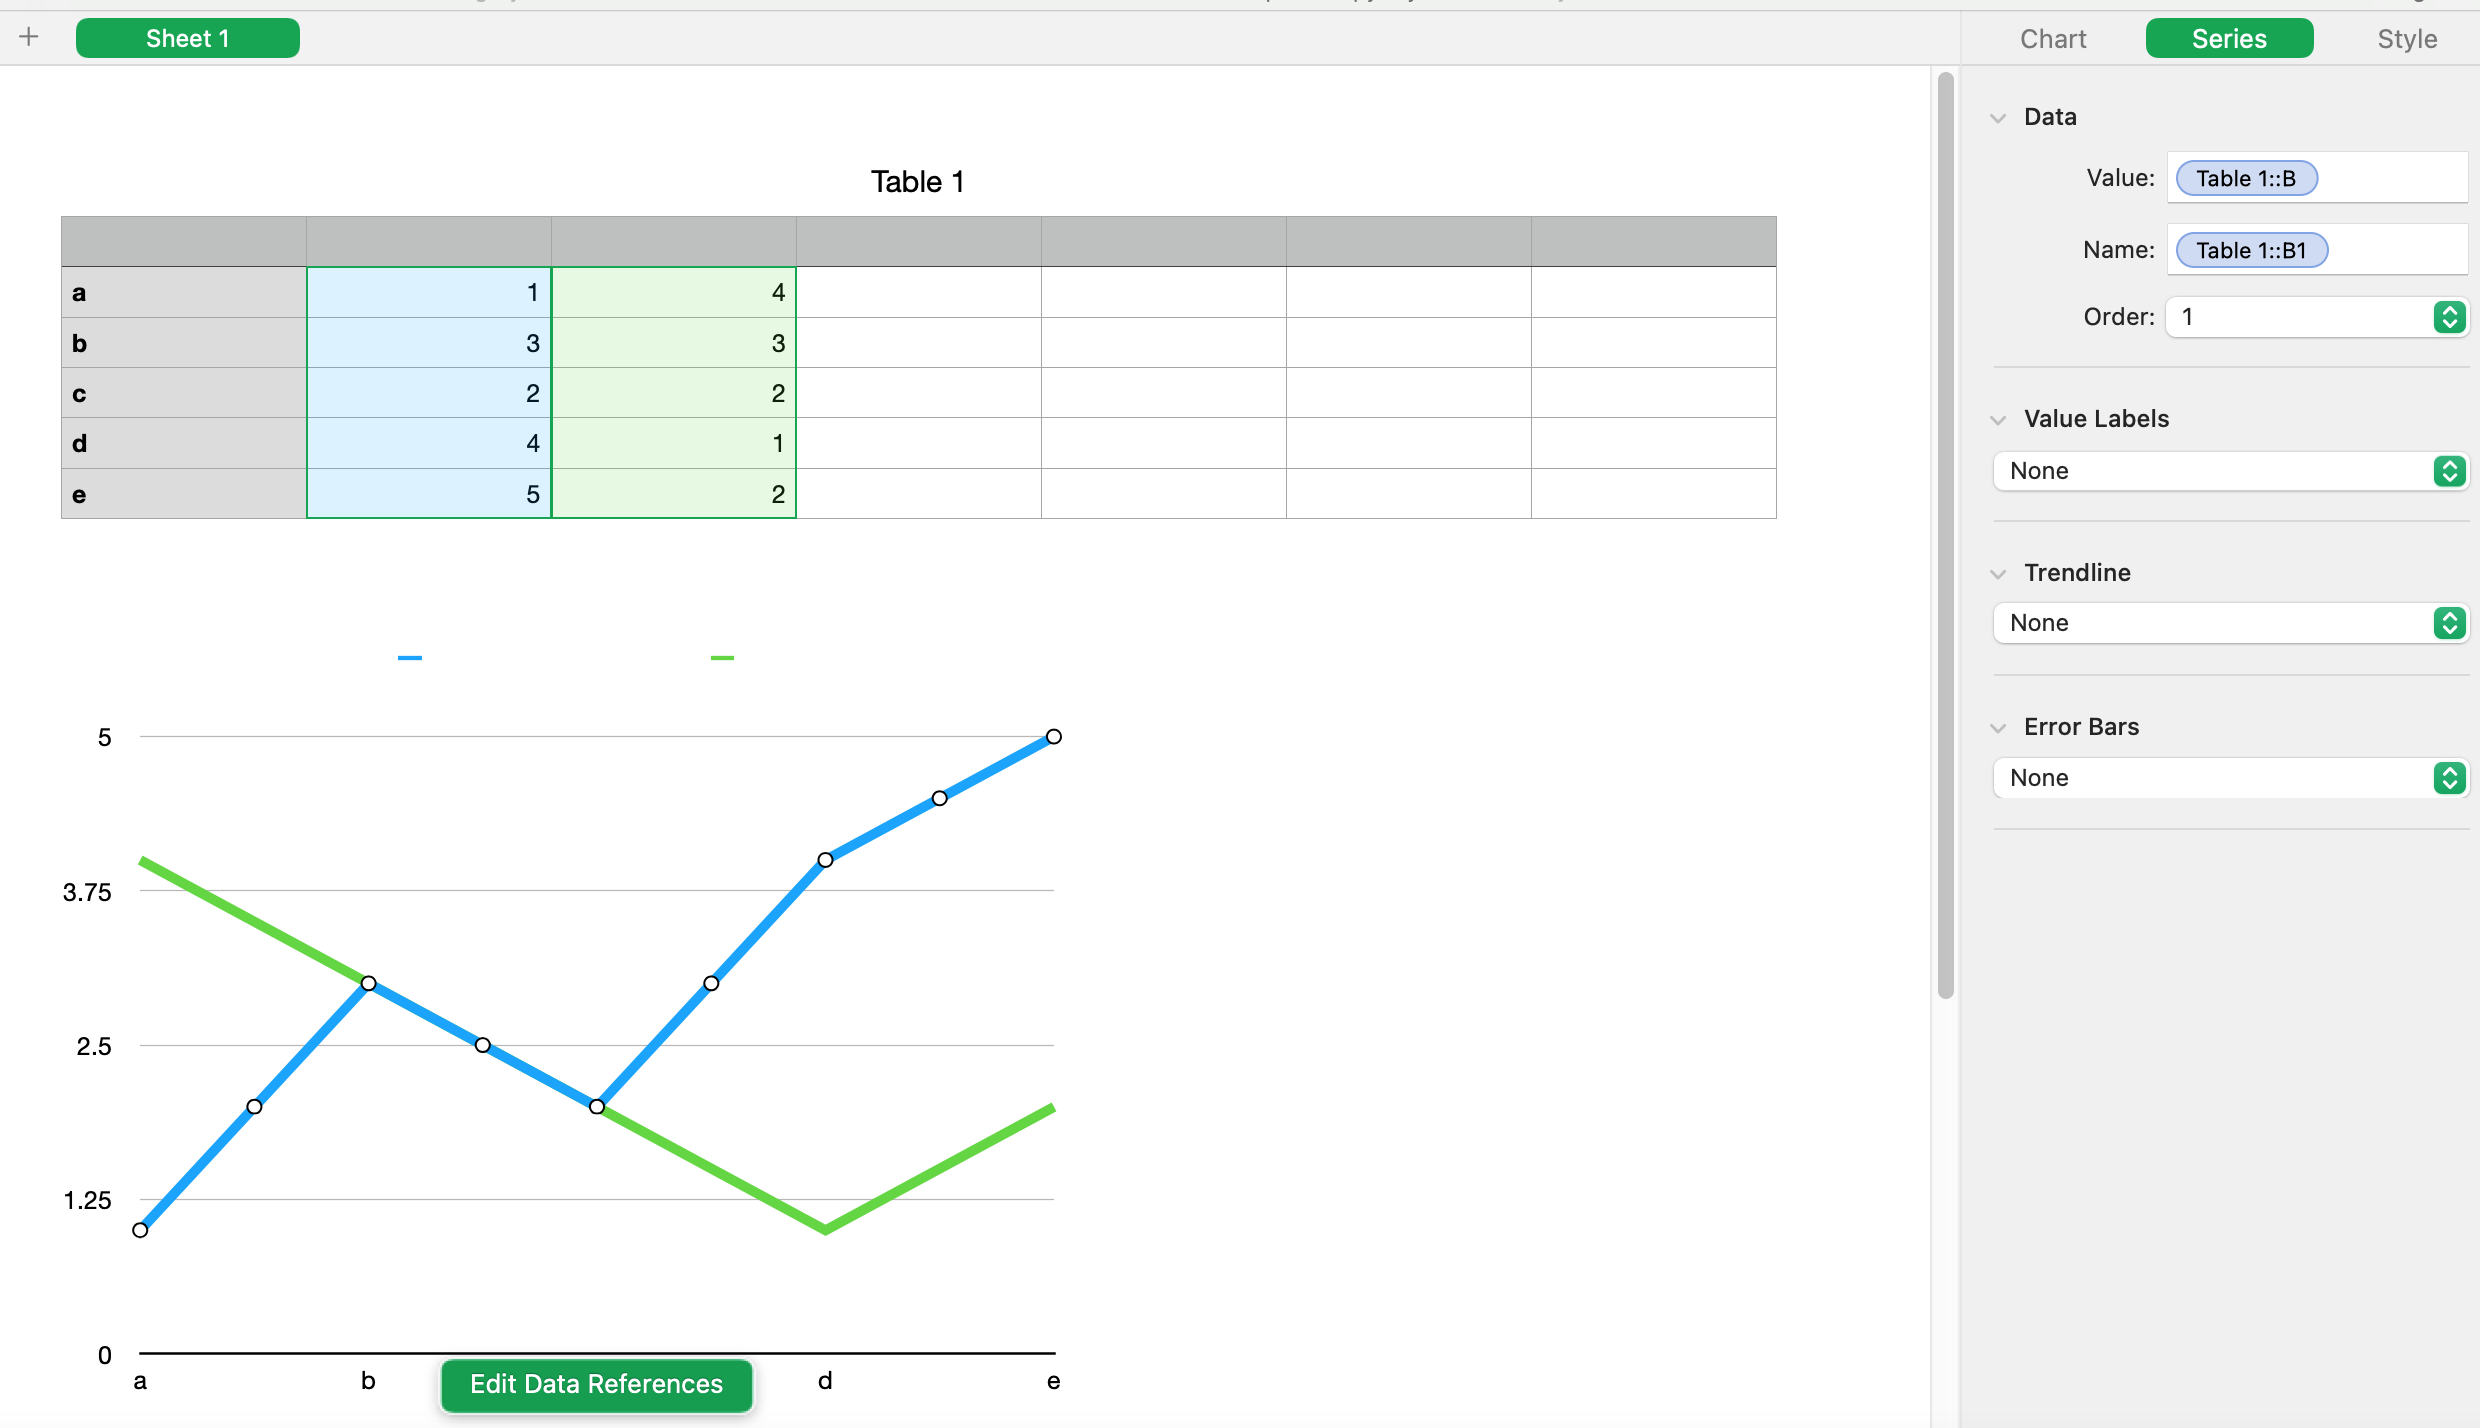
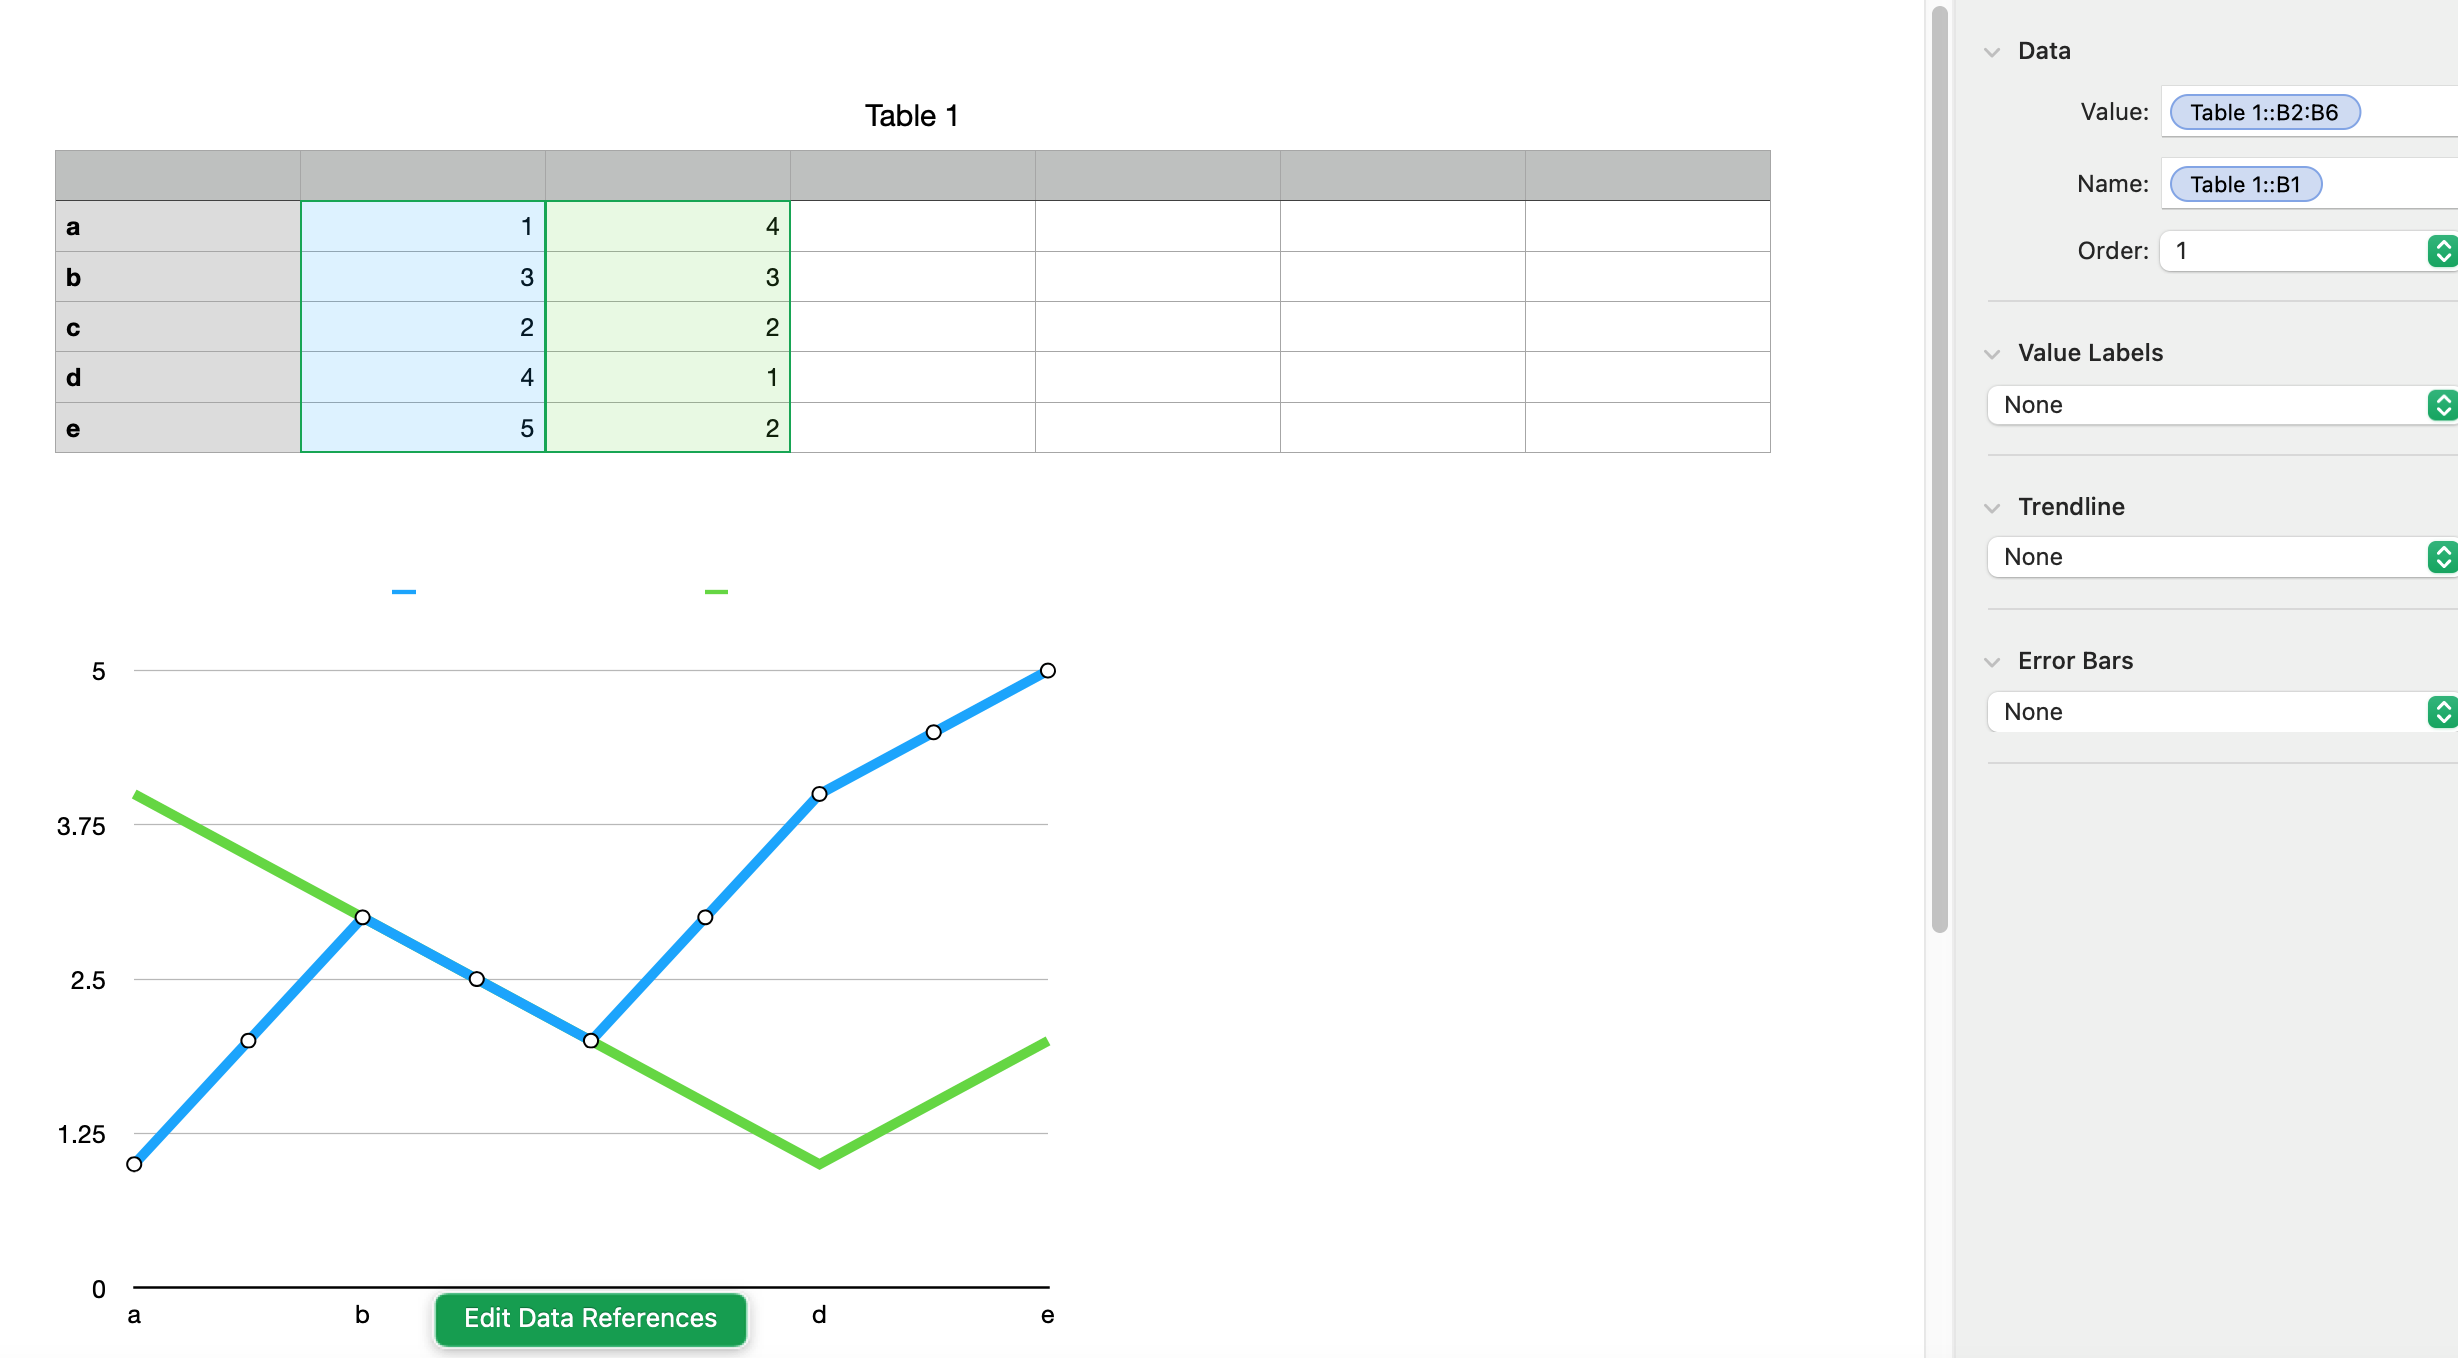
If you make a chart that uses every row of the table, it should make a reference to each series as the entire column, like Table 1::B as seen in the first screenshot below. When the reference is like that, it will (should) automatically include new rows of data. But if the reference is of the form Table 1::B2:B6 like in the second screenshot, it will not automatically include new rows added to the bottom. If your value references look like the second screenshot, you can change them. Click on the chart, click Edit Data References, go to your table, click on one of the colored circles indicating one of the series, click "Select all Body Cells in Column". I believe it will correct all the series, not just the one you clicked on. Of course, only do this if your chart is actually using or supposed to be using all the body cells in the table.
Ralf-F has found a bug about the order in which you enter data. If you find you are having that problem, click on the chart, click on the Axis tab, go to the X axis sub-tab, click somewhere inside the "Label References" box then hit Return without making any changes. The reference is there like it should be but it did not paint the chart with it.